Exchange Ranking
 Top Exchanges
 24h Volume Ranking
 Popularity Ranking
 Exchange BTC Balance
 Proof of Reserves
 Decentralized Exchanges
 Funding Rate
 Funding Heatmap
 Liquidation Data
 Max Pain
 Long/Short Ratio
 Whale L/S Ratio
 Binance/Okex/Huobi L/S
 Bitfinex Margin L/S
 ETF Tracker
 Solana ETF
 XRP ETF
 Hong Kong ETF
 Bitcoin Treasuries
 Crypto Reversal
 Ethereum Reserves
 HyperLiquid Wallet Analysis
 Hyperliquid Whale Watch
 Large Transactions
 On-chain Movement
 Bitcoin ROI
 Stablecoin Market Cap
 Options Analysis
 News
News Articles
 Economic Calendar
 Features
 Wallet
 Contract Calculator


 Security
 Collections
 Watchlist
 Following
 ETH
ETH Ethereum rose by 60.62% in the third quarter. After breaking through the triangular pattern, it may look towards US$3,000.
Ethereum performed strongly in the third quarter of 2026, with a cumulative increase of 60.62%. Prices had previously retreated from the $1,530 to $1,550 range, but quickly recovered to around $2,520 after a strong rebound in late August. Analyst Ali Charts pointed out that if Ethereum can successfully break through the currently forming triangular consolidation pattern, its potential target price may point to US$3,000, a trend that echoes the 31% increase generated during previous breakthroughs. Currently, Ethereum prices are still operating steadily above the 50th and 200th moving averages, with US$2,460 to US$2,493 constituting the key support area, while US$2,585 forming upper resistance. Outlook in the overall market shows a positive trend.
Strong rebound after a sharp decline in the second quarter
Looking back earlier this year, Ethereum prices were above $2,300 in April, but then fell to a low of $1,530 to $1,550 in late June. Since then, the cryptocurrency market has recovered through continued gains in July and early August, with price movements showing a bullish structure of "higher highs" and "higher lows". It is worth noting that Ethereum broke through the key resistance range around August 22. Then, in a fierce rally in late August, prices climbed from about $1,900 to more than $2,450, during which trading volume increased significantly. Since then, Ethereum has consolidated at high levels and is currently trading at close to $2,520. According to Crypto Patel's analysis, Ethereum had previously hit $2,665, and then pulled back to around $2,500 to stabilize. Patel also pointed out that Ethereum has outperformed Bitcoin in the recent past after recording quarterly gains.
Analysts set $3,000 as next target
Analyst Ali Charts said Ethereum's previous triangular breakthrough brought a 31% gain in three days. He added that a new triangular shape is currently being formed on the ETH chart. Ali Charts believes that a similar breakthrough could push Ethereum prices towards $3,000. His analysis focuses on the potential trajectory of prices after breaking out of this developing pattern. At the same time, Michael van de Poppe pointed out that Ethereum may test back in the area near $2,460 after its recent breakthrough. He emphasized that this level must be maintained as an effective support level before his forecast of rising to US$3,000 would be realistic.
Ethereum stands above the main moving average
Ethereum's 50-day moving average is at around $2,493, while its 200-day moving average is around $2,331. Current prices are still above these two moving averages, and the 50-day moving average is already above the 200-day moving average, indicating a strengthening in the medium-term trend. In addition, the 200-day moving average has also begun to show an upward trend.
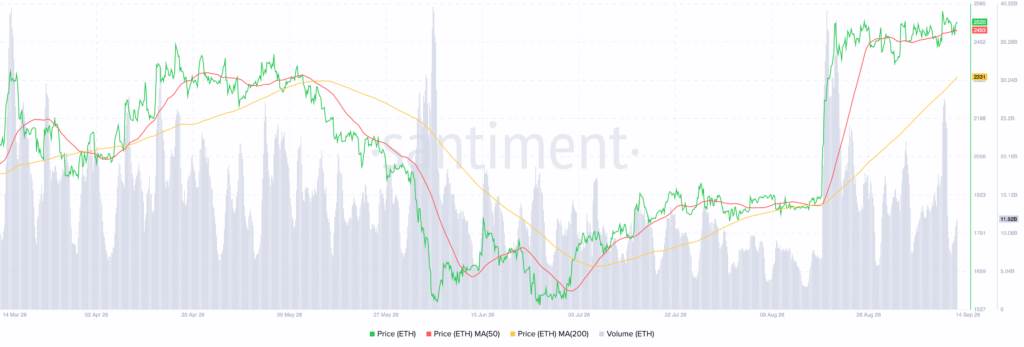
Source: Restoration
On the other hand, the chart shows immediate resistance near US$2,585, close to the upper edge of the recent volatility range. If it continues to stand above $2,493, the current bullish structure will be retained. However, once this level falls below, Ethereum could face the risk of seeking support from $2,331.