Exchange Ranking
 Top Exchanges
 24h Volume Ranking
 Popularity Ranking
 Exchange BTC Balance
 Proof of Reserves
 Decentralized Exchanges
 Funding Rate
 Funding Heatmap
 Liquidation Data
 Max Pain
 Long/Short Ratio
 Whale L/S Ratio
 Binance/Okex/Huobi L/S
 Bitfinex Margin L/S
 ETF Tracker
 Solana ETF
 XRP ETF
 Hong Kong ETF
 Bitcoin Treasuries
 Crypto Reversal
 Ethereum Reserves
 HyperLiquid Wallet Analysis
 Hyperliquid Whale Watch
 Large Transactions
 On-chain Movement
 Bitcoin ROI
 Stablecoin Market Cap
 Options Analysis
 News
 Articles
 Economic Calendar
 Features
 Wallet
 Contract Calculator


 Security
 Collections
 Watchlist
 Following
 BTC
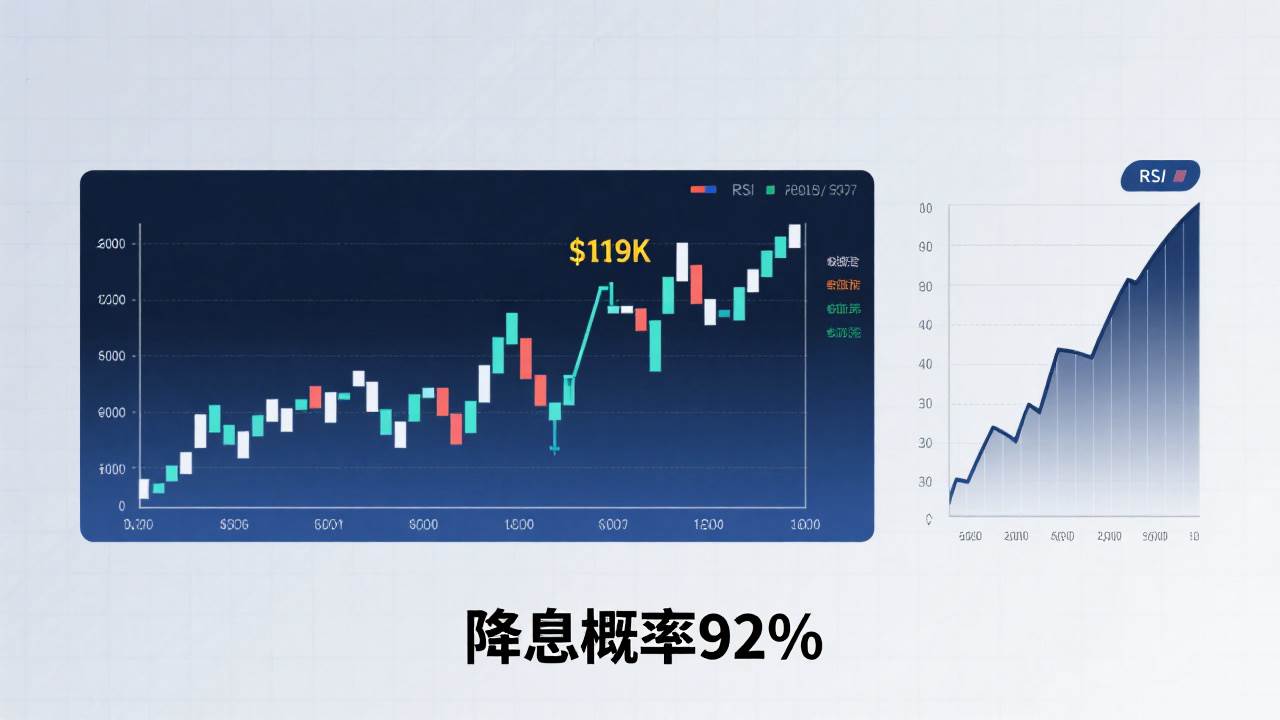
The Bitcoin market is once again facing a critical moment. The current price is hovering around the important support level of $119,000. However, the decline in the RSI indicator indicates a weakening of market momentum. At the same time, the macro environment is changing rapidly. There’s a high probability that the Federal Reserve will cut interest rates by 92%, which is causing investors to become increasingly anxious. Will Bitcoin be able to hold this level, or will it be pushed into further fluctuations due to market sentiment? All these factors deserve our close attention.
The 50-SMA (50-day simple moving average) is at $118,753. This level serves as a dynamic support, having prevented several intraday declines. The 0.236 Fibonacci retracement level of $117,335 remains an effective structural support level.
RSI has rebounded from 40, indicating that selling pressure is decreasing. The MACD histogram has smoothed out, suggesting that bearish momentum is weakening.
If Bitcoin can remain above $117,300, bears might attempt to push the market towards the resistance zone of $123,236. The next technical target is $126,242.

Macroeconomic events are keeping traders nervous.
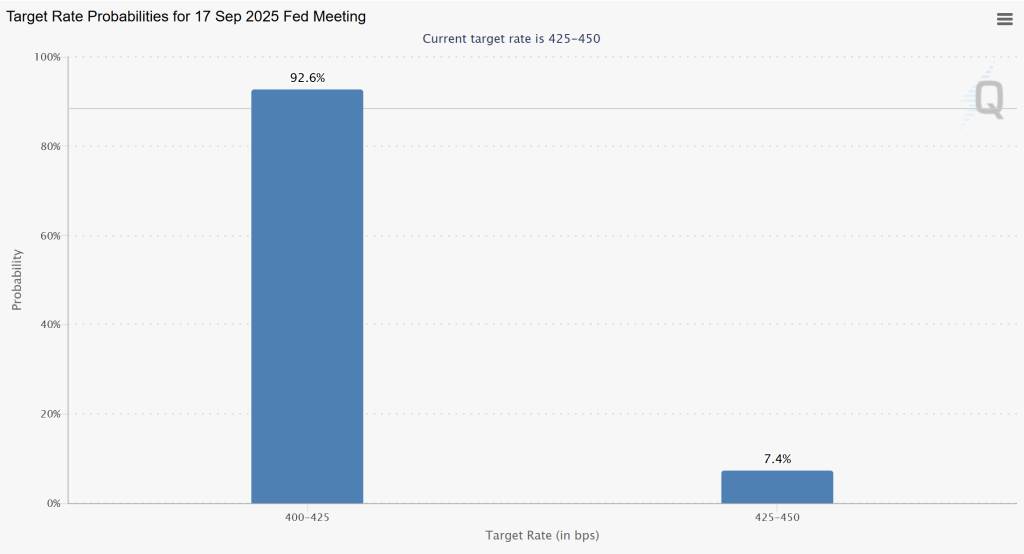
The macro context plays a key role in shaping short-term market sentiment. Data from the CME FedWatch Tool shows that traders currently believe there’s a 92.6% chance that the Federal Reserve will lower interest rates from the current range of 4.25–4.50% to 4.00–4.25% at its meeting on September 17th.
This change in expectations stems from the unexpected increase in US PPI data, which rose by 0.9%, far exceeding the expected 0.2%. Meanwhile, the number of people filing for unemployment benefits at the beginning of each week remains stable at 224,000.
Now let's turn to Friday's data on U.S. retail sales and consumer confidence. These figures will reveal whether the Federal Reserve will continue with its interest rate cuts. If the data shows weak performance, it could boost risk appetite and provide impetus for Bitcoin to break through its resistance levels.
Prediction for the price of Bitcoin (BTC/USD): The technical chart indicates a target of $130K.
From a structural perspective, the price trend remains bullish. The upward channel is still intact, and ongoing pullbacks at higher levels are reinforcing the trend. Once the price breaks through $126K, buying pressure should intensify, pushing prices towards $130K. This level serves as both a supply zone and a psychological resistance level.
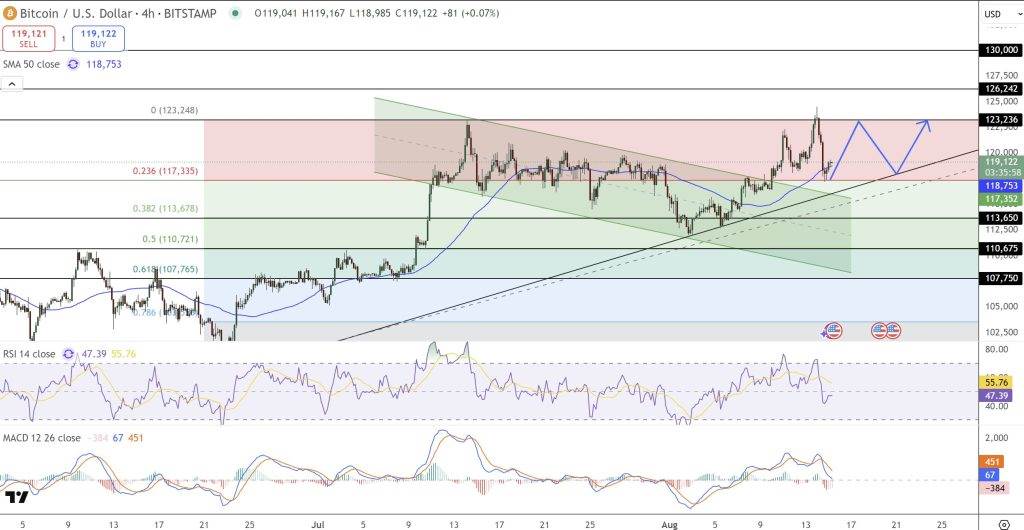
If this break occurs, the upper boundary of the channel could reach $150K in the coming quarters. On the other hand, if the price closes below $117,300, it would hit the invalidation level of $113,650. The 100-SMA (100-period simple moving average) lies at this level.
Trading strategy for Bitcoin (BTC/USD): For traders, the range between $117,300 and $118,000 offers a good risk-reward ratio. Bears could target $123,200 as their first goal, followed by $126,200. A stop loss should be set below $113,650 to prevent further declines.
With technical indicators stabilizing, the Federal Reserve seems more dovish, and upcoming macro catalysts could lead to further moves in Bitcoin prices sooner than expected. If bears can hold onto the current support and regain momentum, a breakthrough towards $130K or even higher is possible.