Exchange Ranking
 Top Exchanges
 24h Volume Ranking
 Popularity Ranking
 Exchange BTC Balance
 Proof of Reserves
 Decentralized Exchanges
 Funding Rate
 Funding Heatmap
 Liquidation Data
 Max Pain
 Long/Short Ratio
 Whale L/S Ratio
 Binance/Okex/Huobi L/S
 Bitfinex Margin L/S
 ETF Tracker
 Solana ETF
 XRP ETF
 Hong Kong ETF
 Bitcoin Treasuries
 Crypto Reversal
 Ethereum Reserves
 HyperLiquid Wallet Analysis
 Hyperliquid Whale Watch
 Large Transactions
 On-chain Movement
 Bitcoin ROI
 Stablecoin Market Cap
 Options Analysis
 News
 Articles
 Economic Calendar
 Features
 Wallet
 Contract Calculator


 Security
 Collections
 Watchlist
 Following
 XRP
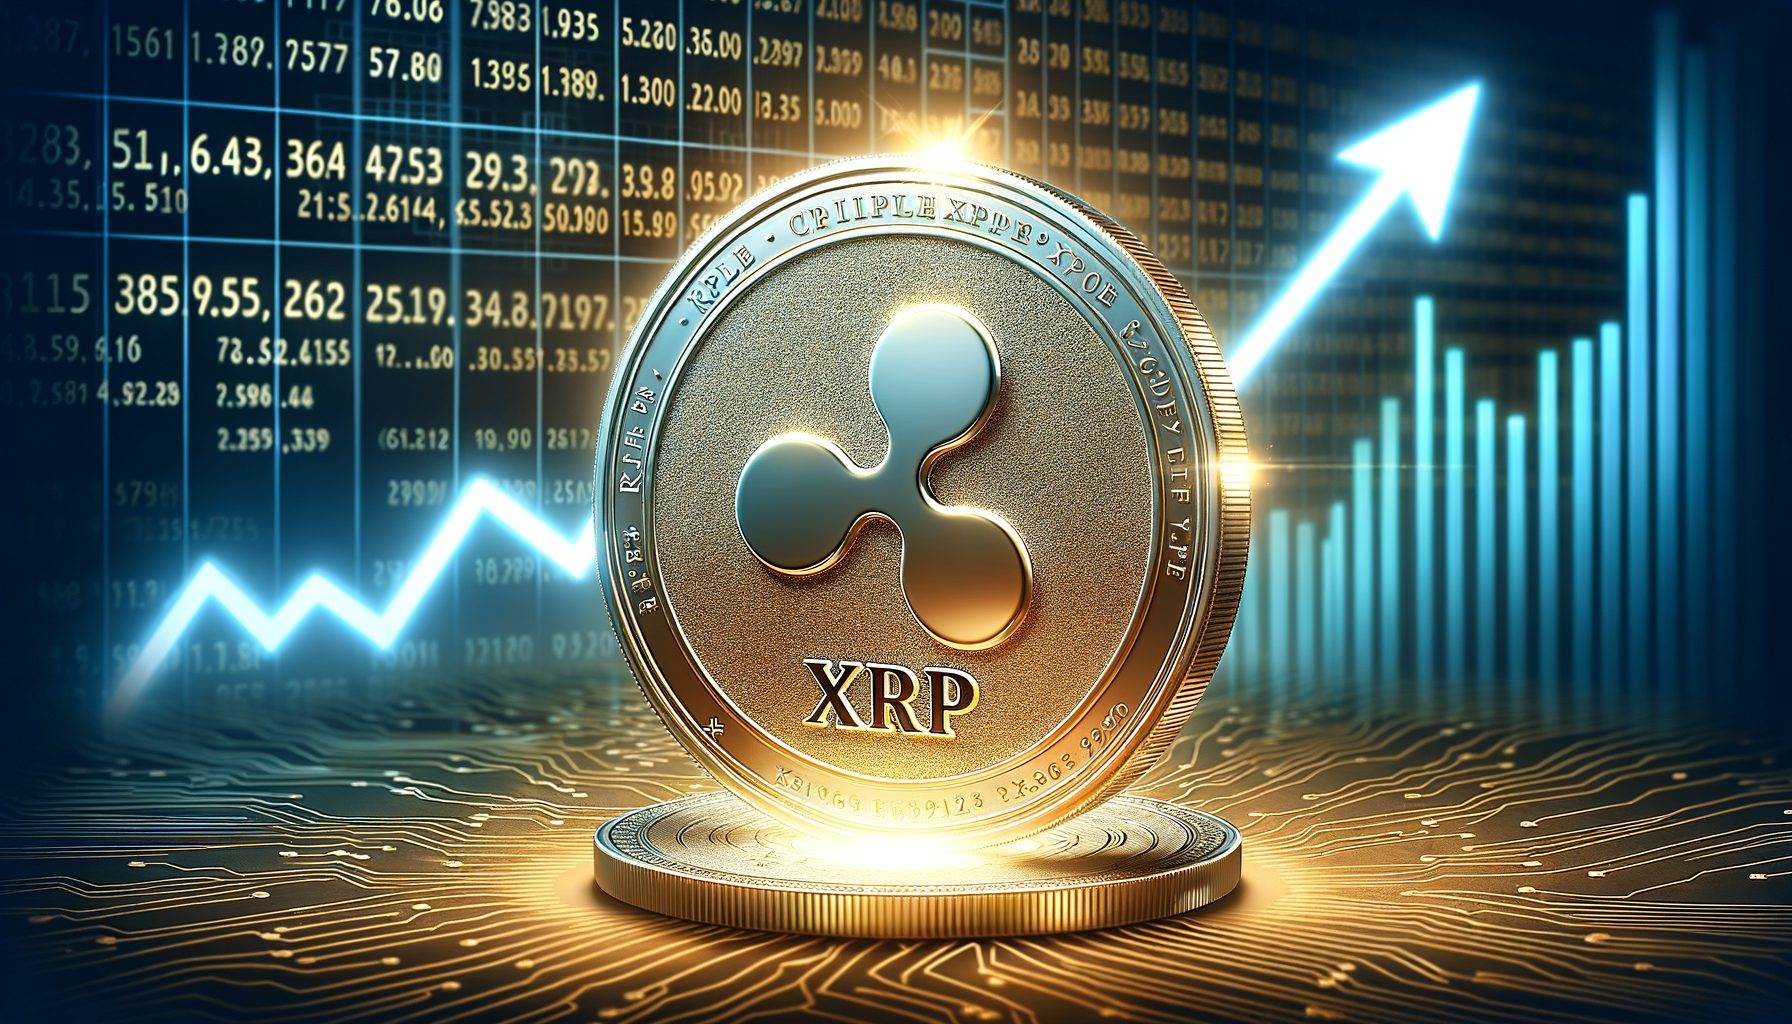
There are predictions regarding the price fluctuations of XRP. Some believe that the price might reach a new high of $5, while others worry that it could fall back to around $2. With institutional investors beginning to reallocate their investments, and as regulations related to fiat currencies become clearer, along with the progress of XRP in cross-border payments and as a stablecoin, market sentiment is clearly divided. In the short term, prices remain vulnerable to overall market movements and policy announcements. However, in the long term, if network applications gain acceptance and market recognition, XRP still has the potential for a steady rebound. Currently, investors need to find a balance between risk management and opportunity identification.
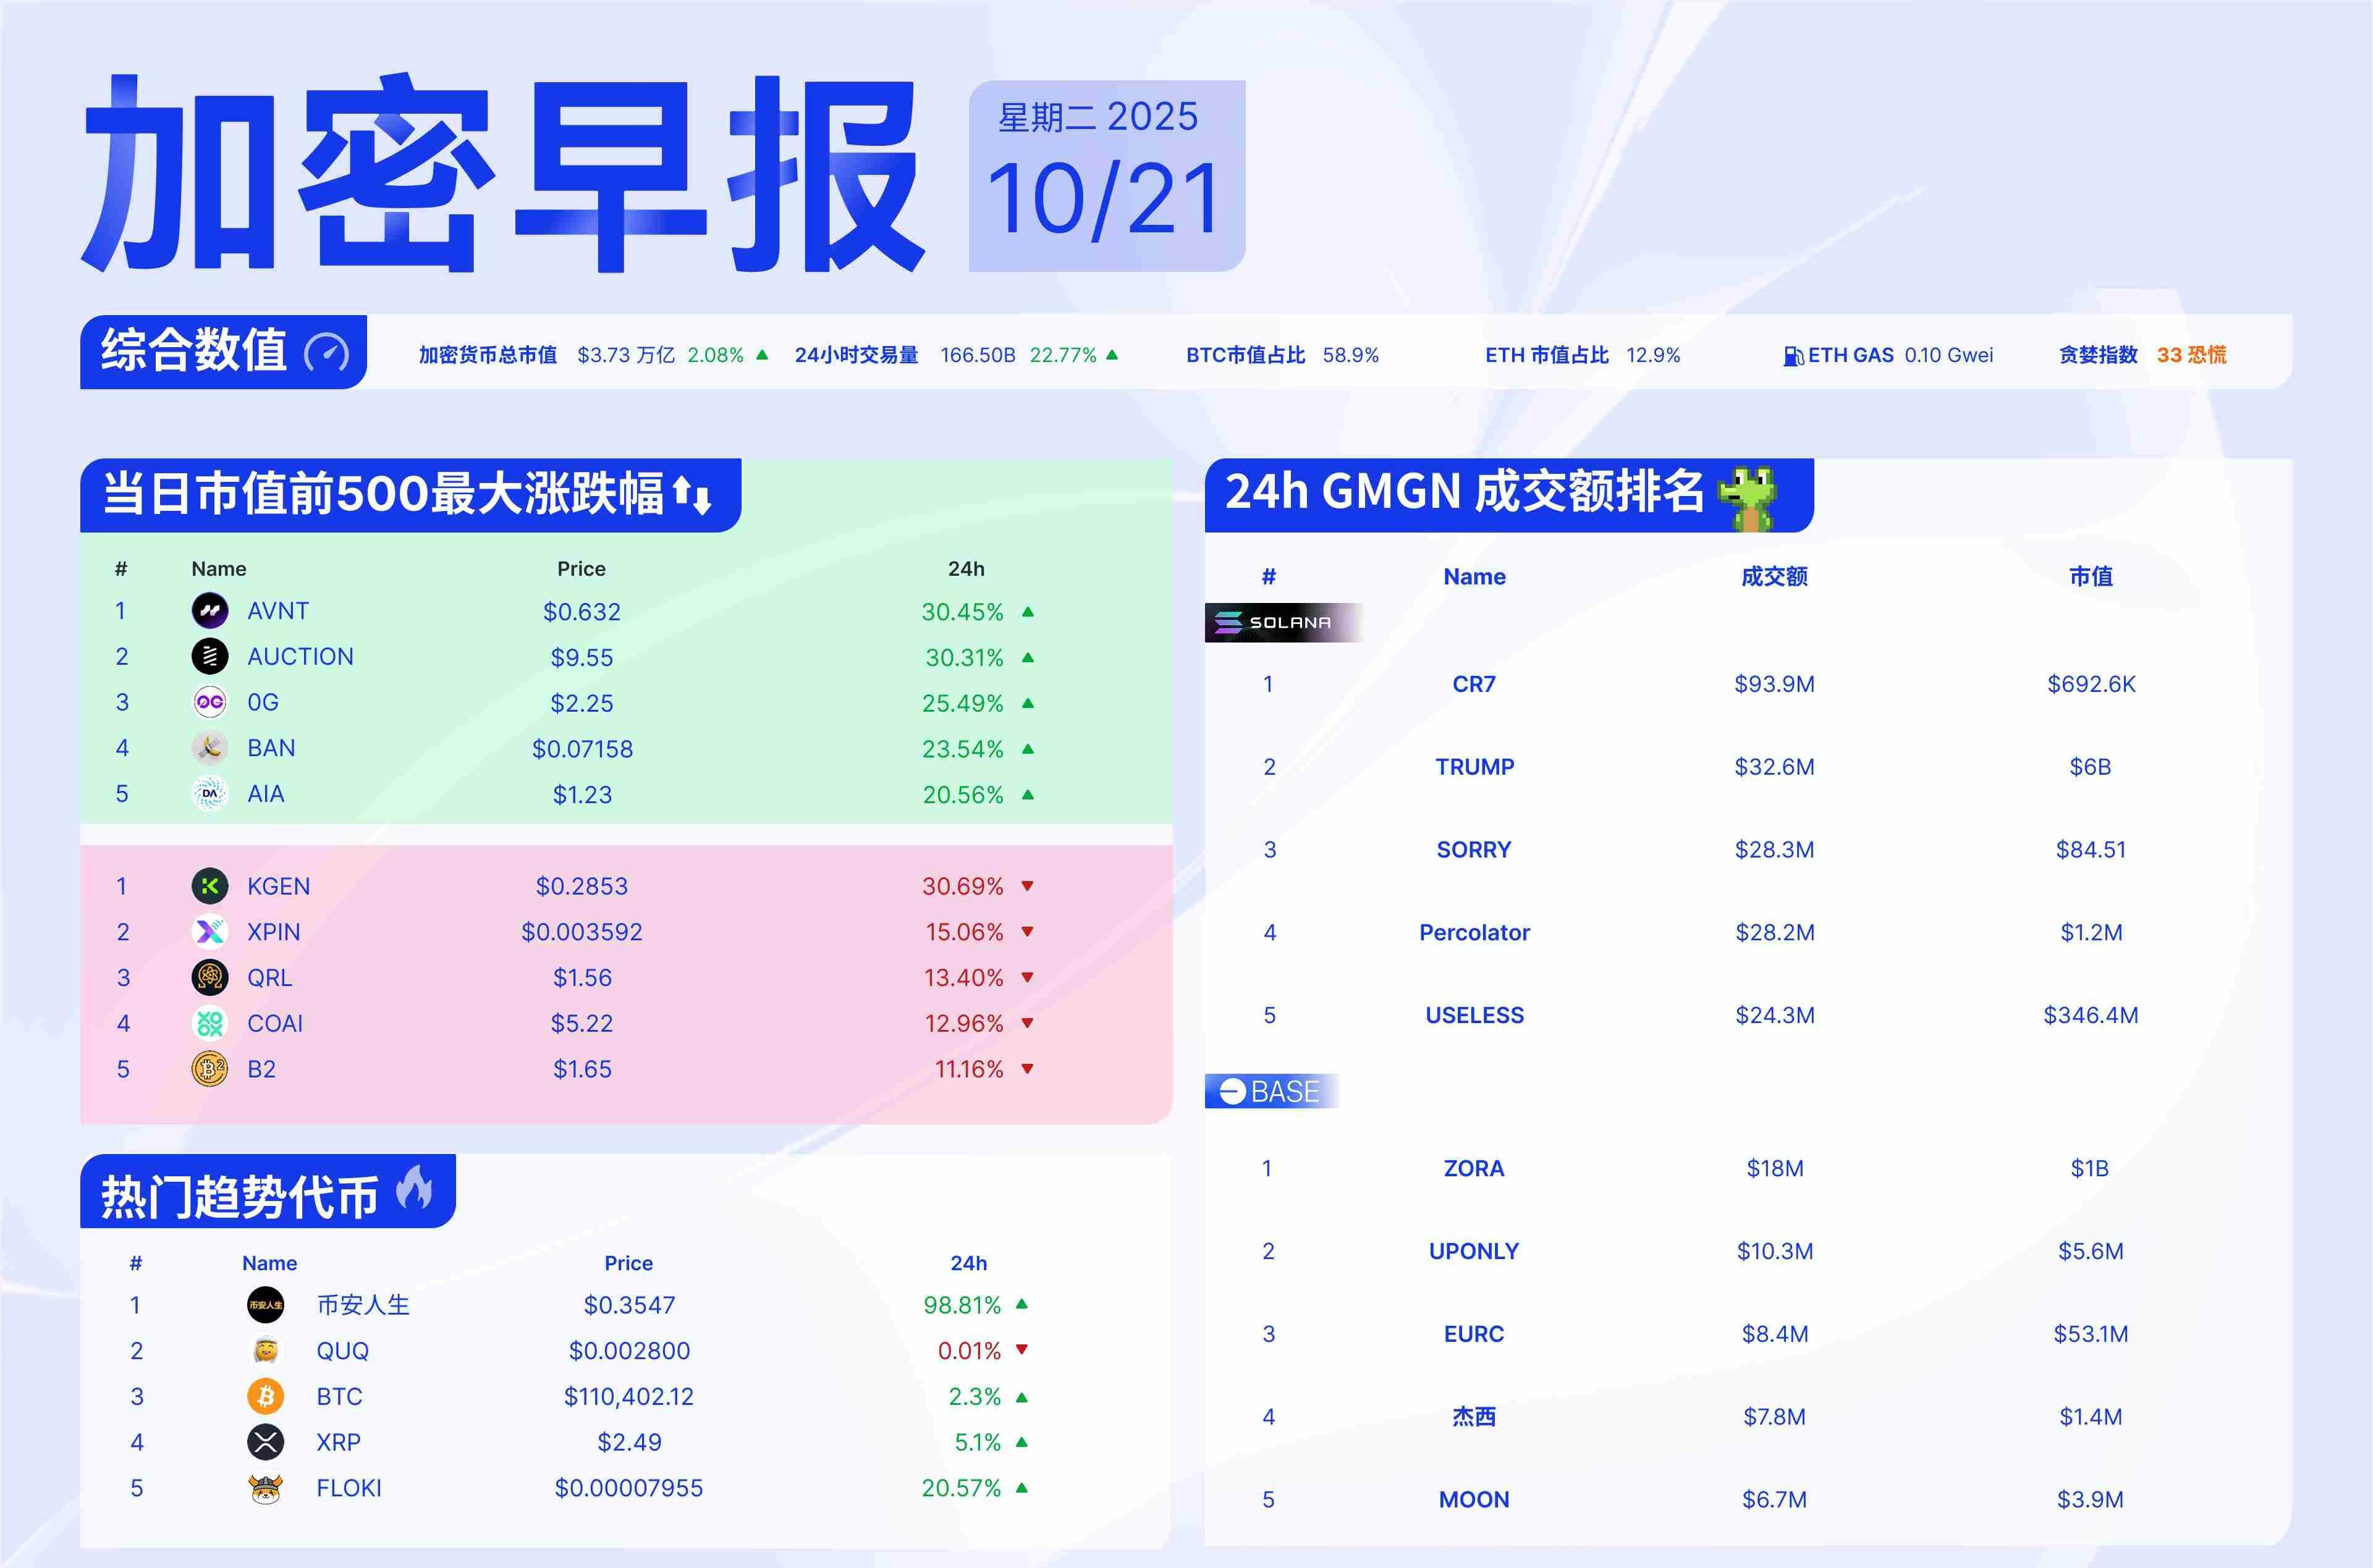
As of the time of writing, the trading price of XRP is approximately $2.46. Over the past 24 hours, the asset has increased by 5.86%, but it has still fallen by 5% this week.
Analysts are tracking key price levels, historical signals, and trading behavior, indicating that XRP may be entering a new phase in its market structure.
The price remains within the long-term demand range.
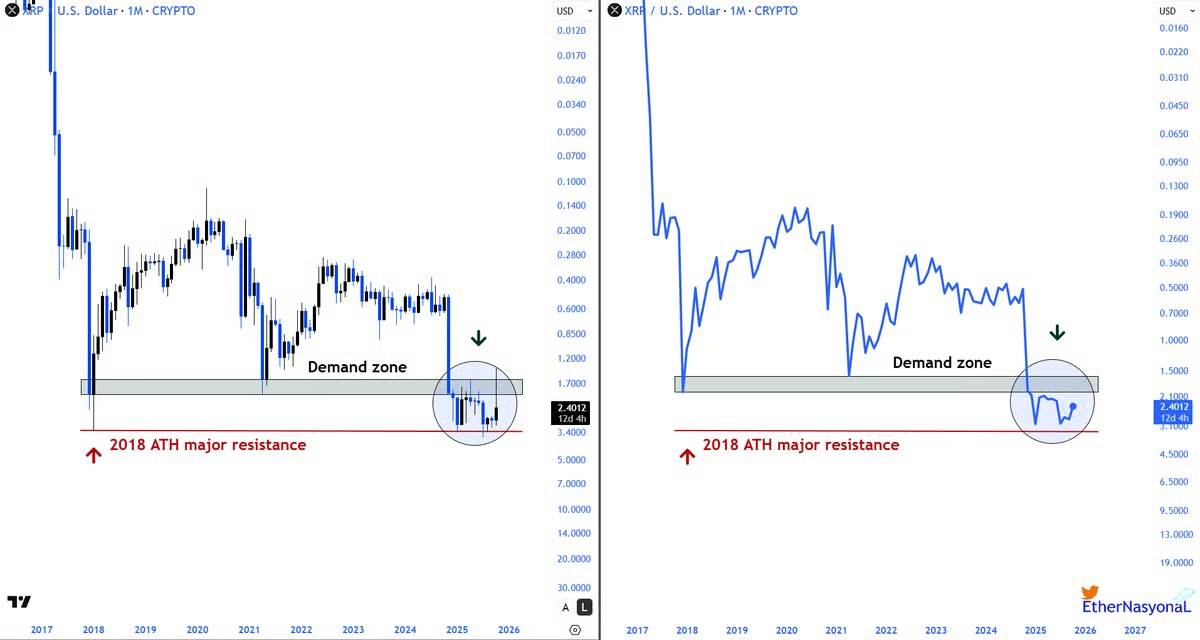
Renowned trader and analyst EtherNasyonaL used an inverted monthly chart to illustrate XRP’s long-term trend, highlighting its structural patterns. This chart focuses on the demand area that originated from the historical high in 2018. This area currently serves as a support level.
XRP has been trading within this range for several months. The chart shows that XRP has repeatedly tested the lower limit without making any significant breakthroughs. Analysts say that XRP is “accumulating strength” and “preparing for another major increase.” From a reversal perspective, its structure resembles a round bottom, which is typically associated with trend reversals.
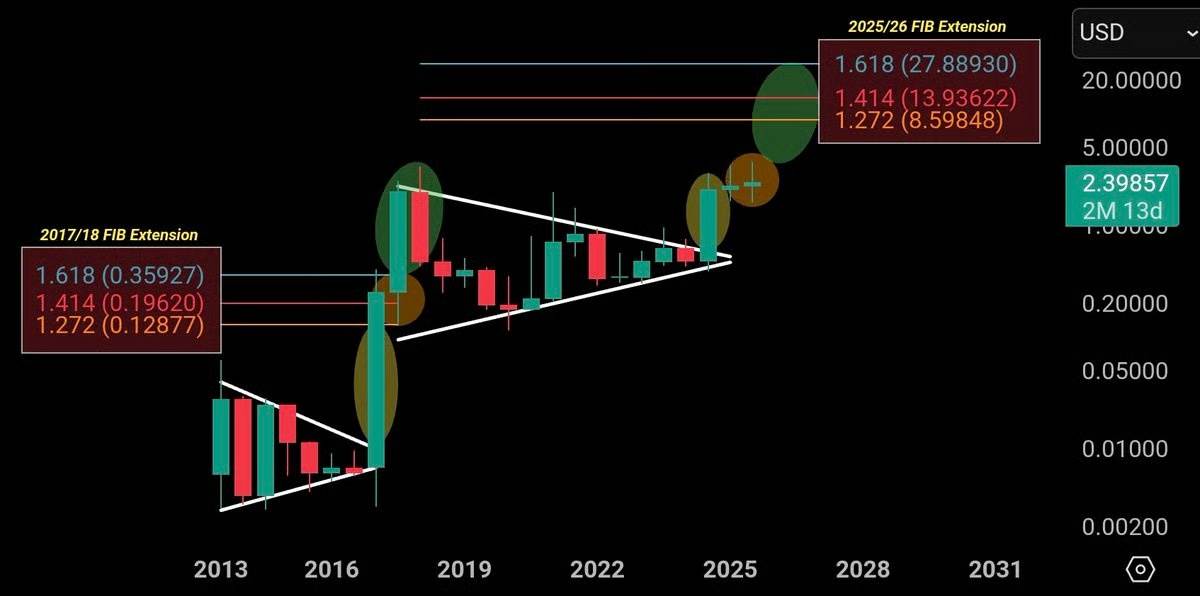
The six-month chart indicates a target of
. Another analyst, ChartNerd, presented a six-month K-line chart, using Fibonacci extensions to predict the future trend of XRP. Although there were some upward shadows in recent days, the K-line chart shows that the trend remains stable. Lows and highs continue to rise.
Interestingly, based on past cycles and support levels, analysts suggest that prices of $5, $8.59, $13.93, and $27.88 could be potential targets. According to this analysis, there are no signs of collapse in this structure, and it still seems favorable for continued growth.
Market sentiment has reached its lowest point this year
. Steph Is Crypto examined the net unrealized profits and losses (NUPL) of short-term XRP holders. The chart shows that short-term holders have fallen to a deeply negative level, reaching -0.20. This level is lower than any previous levels seen in the chart over the past year.
Previously, the market has fallen into this “surrender” zone several times, in October 2024, March 2025, and June 2025, all around market lows. The analyst explained that these events always signify a market bottom, and warned, “This is absolutely the worst time to exit.” “Now is definitely the worst time to sell.”
Additionally, Cryptoinsightuk recently created a chart showing the liquidity range of XRP over a daily time frame. The most active area is between $2.20 and $2.80, and this area has remained a support level. Above the current level, liquidity exists between $3.00 and $3.40. If prices rise, this area may be tested.
At the same time, CryptoPotato reports that the number of wallets holding more than 10,000 XRPs has reached a record high of 317,500. This trend has continued for nearly a year, with a brief pause at the end of 2024. Analysts believe that this current pattern corresponds to the fourth wave of consolidation that could occur according to Elliott Wave theory.