Exchange Ranking
 Top Exchanges
 24h Volume Ranking
 Popularity Ranking
 Exchange BTC Balance
 Proof of Reserves
 Decentralized Exchanges
 Funding Rate
 Funding Heatmap
 Liquidation Data
 Max Pain
 Long/Short Ratio
 Whale L/S Ratio
 Binance/Okex/Huobi L/S
 Bitfinex Margin L/S
 ETF Tracker
 Solana ETF
 XRP ETF
 Hong Kong ETF
 Bitcoin Treasuries
 Crypto Reversal
 Ethereum Reserves
 HyperLiquid Wallet Analysis
 Hyperliquid Whale Watch
 Large Transactions
 On-chain Movement
 Bitcoin ROI
 Stablecoin Market Cap
 Options Analysis
 News
 Articles
 Economic Calendar
 Features
 Wallet
 Contract Calculator


 Security
 Collections
 Watchlist
 Following
 BTC
It has always been difficult for Bitcoin to maintain a consistent correlation with gold. Recently, they have only shown synchronous movements during market downturns. However, if we consider Bitcoin’s price movements in relation to gold rather than the US dollar, we can gain a more comprehensive understanding of current market cycles. By measuring Bitcoin’s real purchasing power relative to comparable assets, we can identify potential support levels and determine when the bear market cycle may come to an end.

The end of the Bitcoin bear market is occurring earlier than what the US dollar chart indicates—gold prices have already fallen below the 350-day moving average and key Fibonacci support levels. This is a consolidation zone.
The Bitcoin bear market has officially begun, with prices falling below key support levels.
When Bitcoin drops below the 350-day moving average (approximately $100,000) and important six-digit psychological barriers, it indicates that Bitcoin has indeed entered a bear market. Subsequently, prices fell by approximately 20%. From a technical perspective, when Bitcoin’s price falls below the golden ratio moving average, it usually signals the start of a bear market cycle. But if we use gold as the benchmark instead of the US dollar, the situation becomes even more interesting.
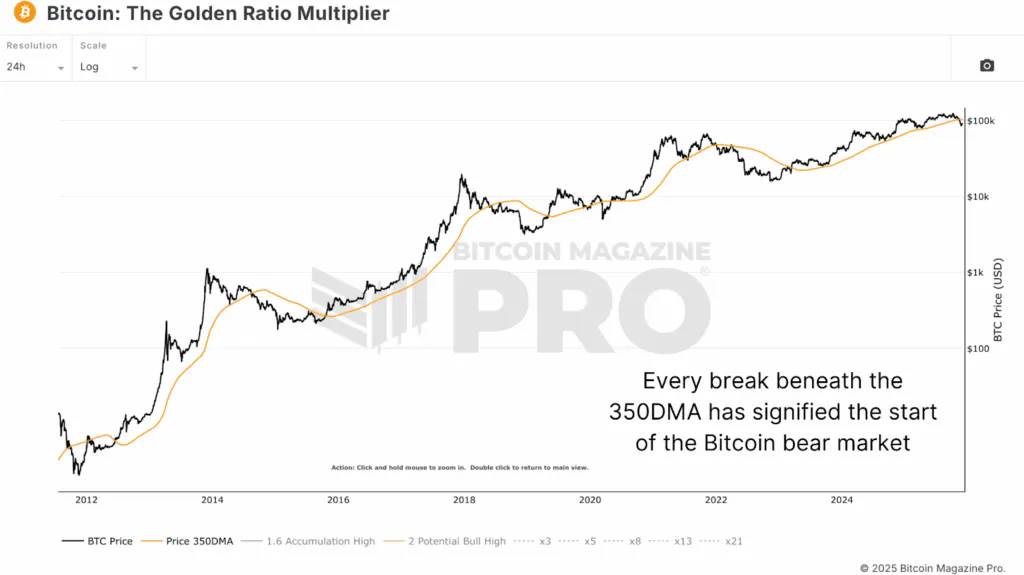
Figure 1: Historically, when Bitcoin falls below the 350-day moving average, it usually coincides with the beginning of a bear market. Check the real-time chart.
The chart of Bitcoin’s relationship to gold shows a completely different trend compared to that of the US dollar. Bitcoin reached its peak in December 2024, after which it fell by more than 50%. In contrast, the value of the US dollar peaked in October 2025, far below the high it reached the previous year. This divergence indicates that the bear market for Bitcoin may last much longer than most observers expect. Looking back at the historical bear markets of Bitcoin, based on gold as a reference point, we can identify some patterns suggesting that the current pullback may be approaching a key support level.
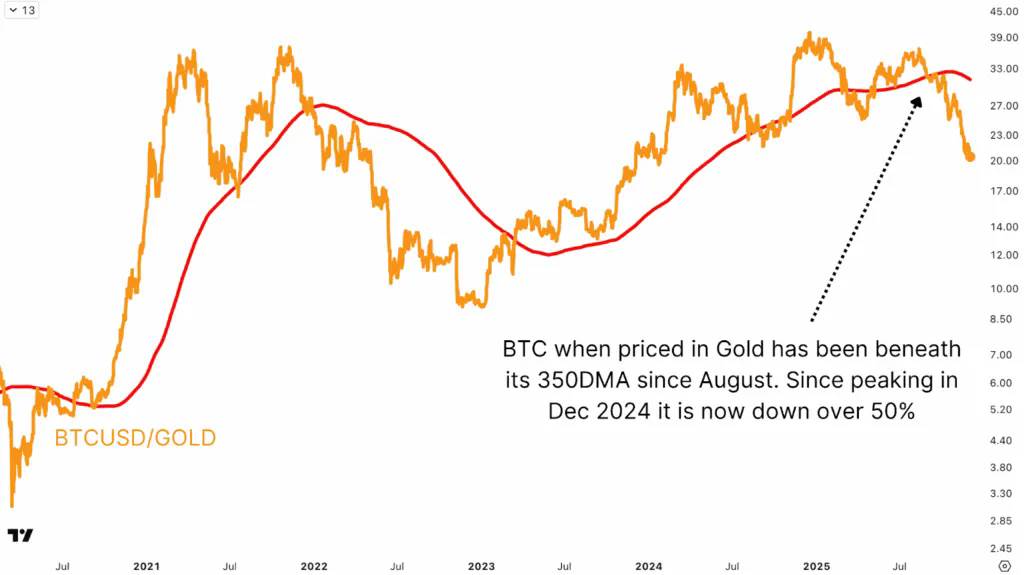
Figure 2: When measured in terms of gold, Bitcoin fell below its 350-day moving average in August.
The bear market in 2015 lasted 406 days, with a 86% decline from its peak. The bear market in 2017 lasted 364 days, with a 84% decline. The last bear market lasted 399 days, with a 76% decline. As of the time of writing, the price of Bitcoin relative to gold has fallen by 51% in 350 days. Although the percentage decline has decreased due to the growing market value of Bitcoin and increased inflows of capital, this reflects not a fundamental change in the cyclical dynamics, but rather an increasing use of Bitcoin by institutional investors and a decrease in Bitcoin supply.
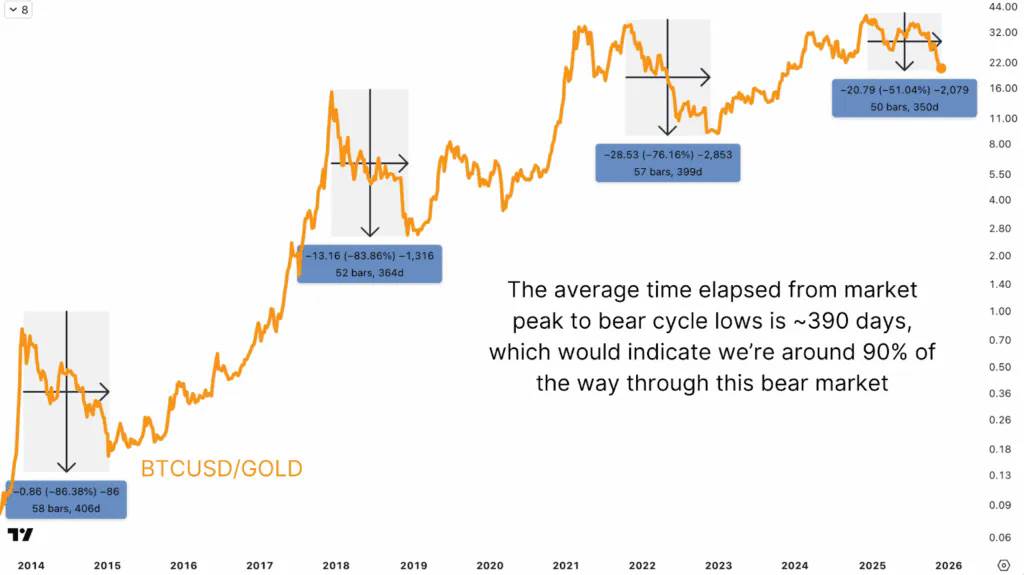
Figure 3: Plotting Bitcoin’s value against gold reveals a cyclical pattern indicating that we may have already passed 90% of this bear market.
Multi-cycle convergence signals suggest that the bottom of the Bitcoin bear market is approaching.
Compared to relying solely on percentage-based retracements and time elapsed, using Fibonacci retracements that span multiple periods provides greater accuracy. Analyzing the market from the bottom up using Fibonacci tools reveals remarkable overlaps between different periods.
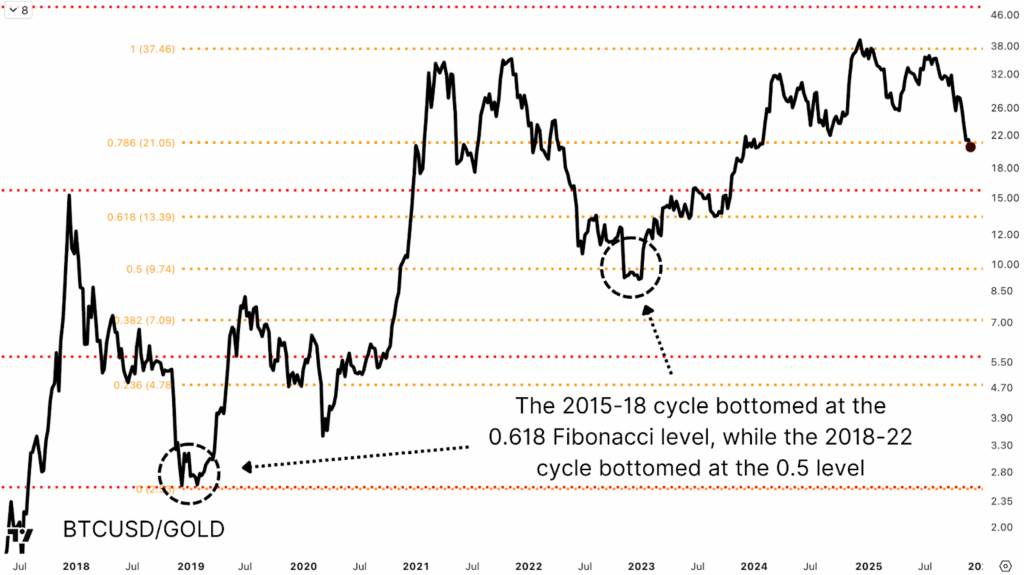
Figure 4: In previous periods, the bottoms of bear markets coincided with key Fibonacci retracement levels.
During the period from 2015 to 2018, the bottoms of bear markets occurred at 0.618 Fibonacci levels, which corresponds to approximately 2.56 ounces of gold per Bitcoin. The resulting price movements clearly indicated the bottoms, much more clearly than the corresponding dollar charts. In the period from 2018 to 2022, the bottoms of bear markets almost perfectly coincided with 0.5 Fibonacci levels, which corresponds to approximately 9.74 ounces of gold per Bitcoin. After the subsequent bull market, Bitcoin re-established itself at these levels, but they later became important resistance levels.
Converting the Bitcoin-bear market gold ratio back to dollar prices shows that from the previous bear market lows to the current bull market highs, the 0.618 Fibonacci retracement level corresponds to approximately 22.81 ounces of gold per Bitcoin, while the 0.5 Fibonacci retracement level corresponds to 19.07 ounces of gold per Bitcoin. Currently, Bitcoin prices are fluctuating around the midpoint of these two retracement levels. From a purchasing power perspective, this may be an attractive area for accumulation.
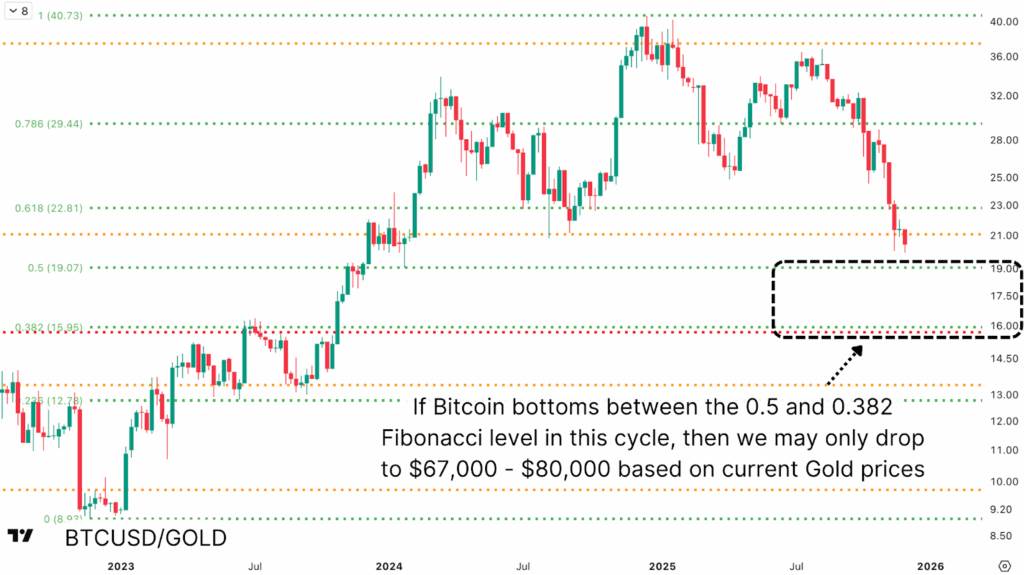
Figure 5: Using Fibonacci levels to predict market lows for Bitcoin relative to gold, and then converting these lows into dollars, helps determine where Bitcoin prices might have reached their bottom.
Multiple Fibonacci levels from different cycles converge together, creating further trends. The 0.786 level of the current cycle corresponds to approximately 21.05 ounces of gold, with the corresponding Bitcoin price being around $89,160. The 0.618 level of the previous cycle again approaches $80,000. These convergence points indicate that if Bitcoin continues to decline, the next important technical target is around $67,000. This target stems from the 0.382 Fibonacci retracement level, which corresponds to approximately 15.95 ounces of gold per Bitcoin unit.