Exchange Ranking
 Top Exchanges
 24h Volume Ranking
 Popularity Ranking
 Exchange BTC Balance
 Proof of Reserves
 Decentralized Exchanges
 Funding Rate
 Funding Heatmap
 Liquidation Data
 Max Pain
 Long/Short Ratio
 Whale L/S Ratio
 Binance/Okex/Huobi L/S
 Bitfinex Margin L/S
 ETF Tracker
 Solana ETF
 XRP ETF
 Hong Kong ETF
 Bitcoin Treasuries
 Crypto Reversal
 Ethereum Reserves
 HyperLiquid Wallet Analysis
 Hyperliquid Whale Watch
 Large Transactions
 On-chain Movement
 Bitcoin ROI
 Stablecoin Market Cap
 Options Analysis
 News
 Articles
 Economic Calendar
 Features
 Wallet
 Contract Calculator


 Security
 Collections
 Watchlist
 Following
 BTC
These past few days have been extremely volatile for gold prices. From Tuesday to Wednesday, the price dropped by 8%, nearly reaching the support level of $4,000. At the same time as gold plummeted, Bitcoin unexpectedly rebounded, with its price soaring to $114,000. However, it soon fell back down, wiping out all previous gains. The market is currently unstable, and everyone is speculating about where Bitcoin will go next.
The rebound failed, and Bitcoin’s price returned to its original level.
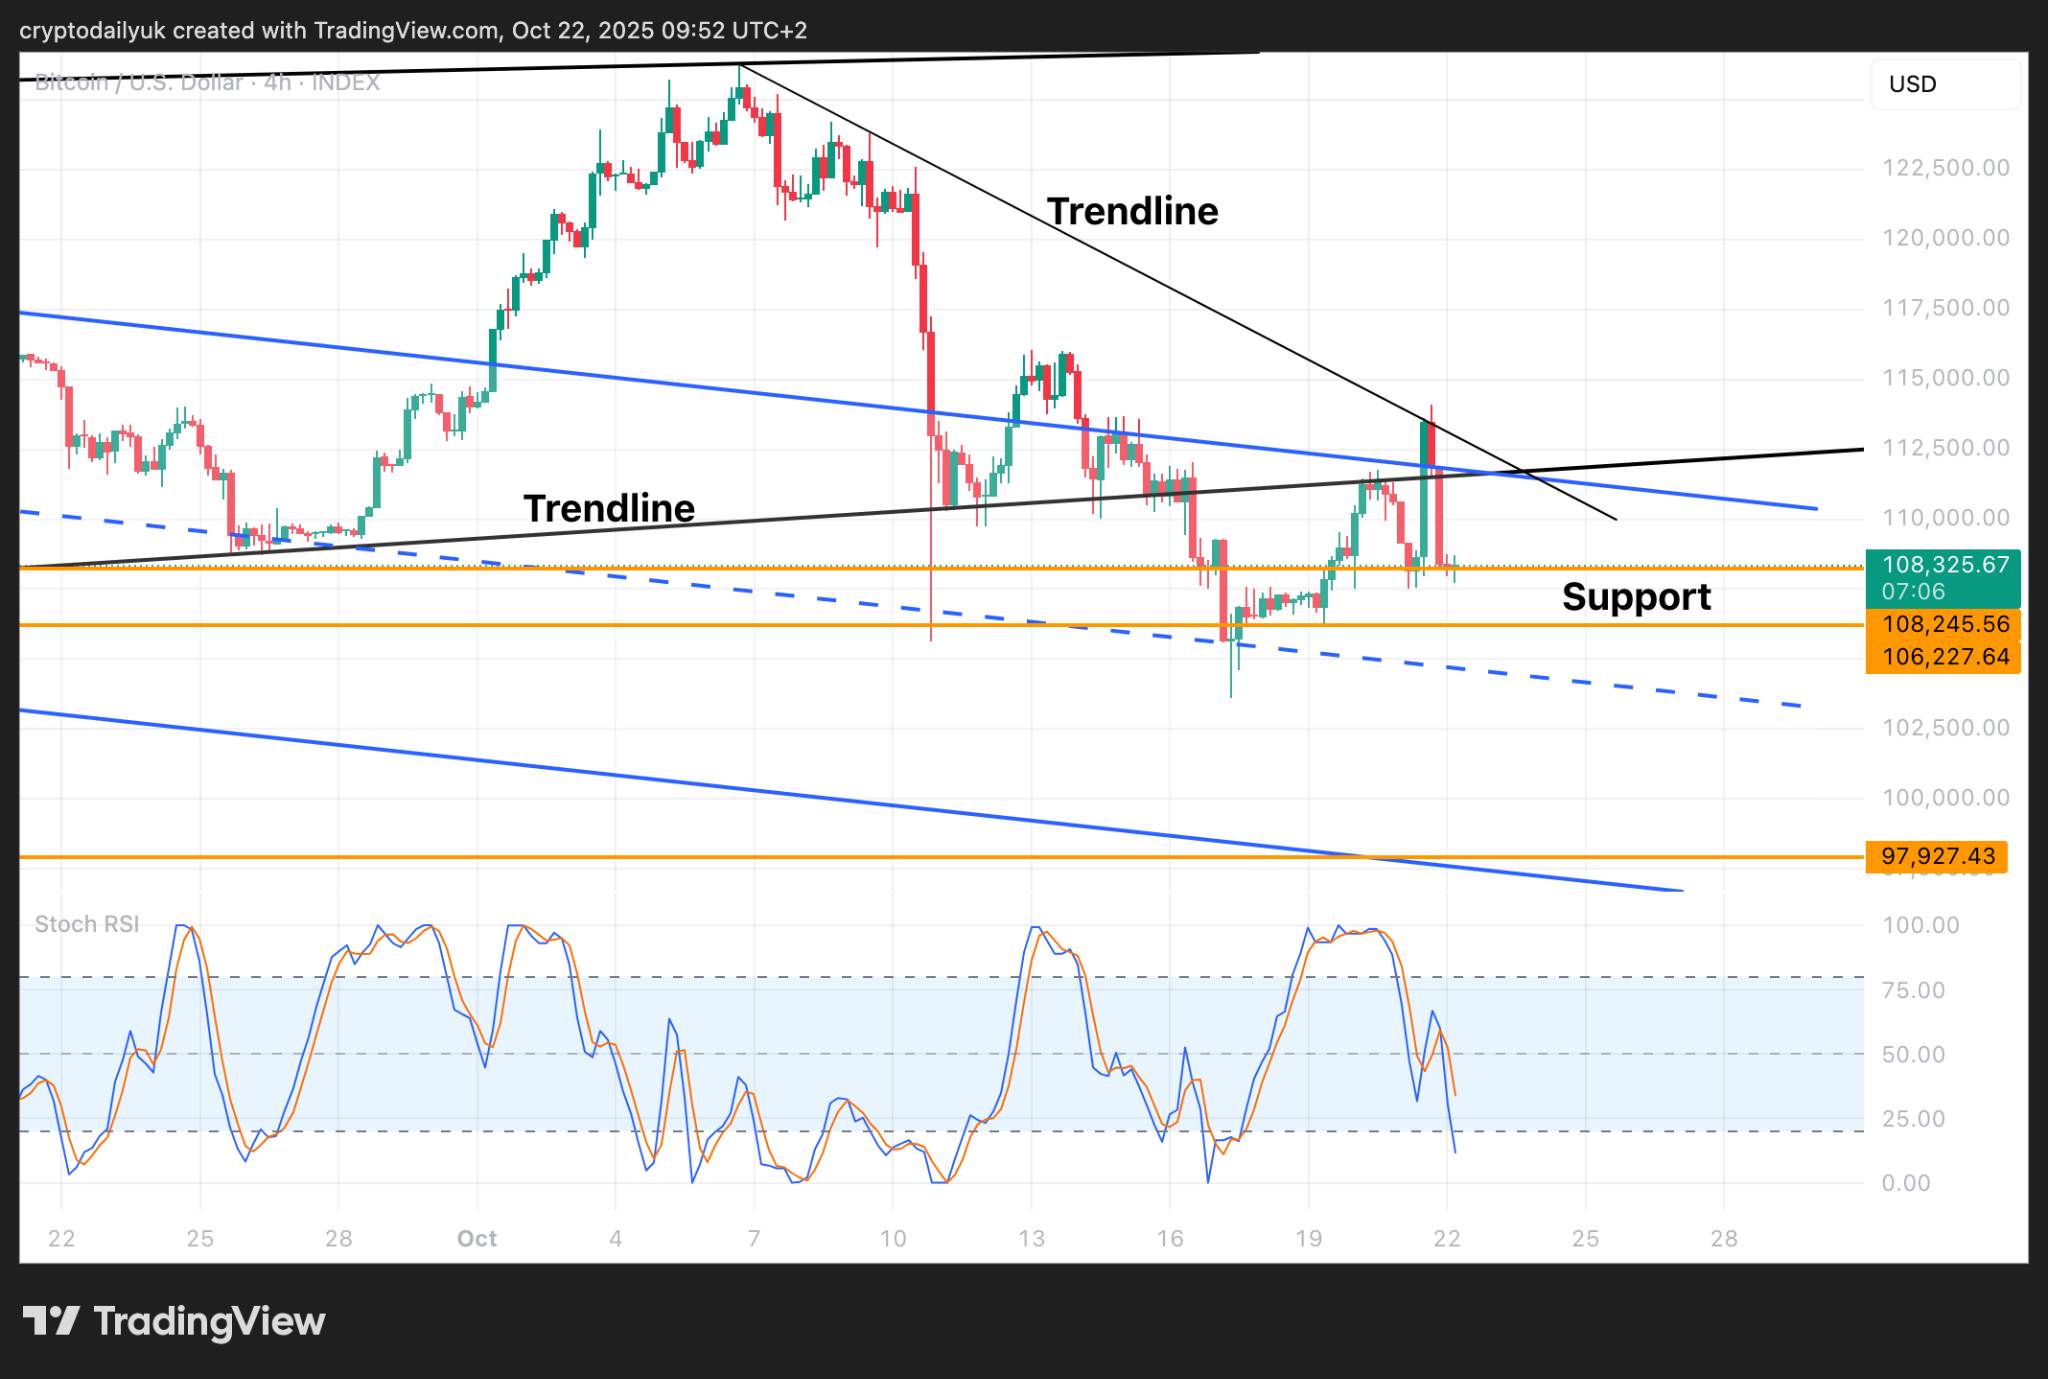
The unexpected surge in Bitcoin’s price may have caught many people off guard. Just moments ago, the price was still fluctuating around the $108,000 support level, but suddenly it skyrocketed. Within an hour, the price increased by $3,700, breaking through the main trend line and the top of the channel (the blue area). Subsequently, the price rose to a historical high, but then fell back to the top of the channel again. Eventually, it returned to the $108,000 support level. In total, Bitcoin’s price increased by $5,500 or 5%.
According to Coinglass, within 24 hours, over $652 million in long and short positions were closed, and more than 160,000 traders were liquidated.
It seems that the current market cannot tolerate any leverage. Market makers might be smugly smiling, knowing that traders are seizing the opportunity to buy Bitcoin, as its price has easily broken through resistance and could rise rapidly. But things don’t go as planned. Bitcoin traders are now struggling to recover from their losses.
The bearish pattern has been confirmed. The prices of $BTC
,, 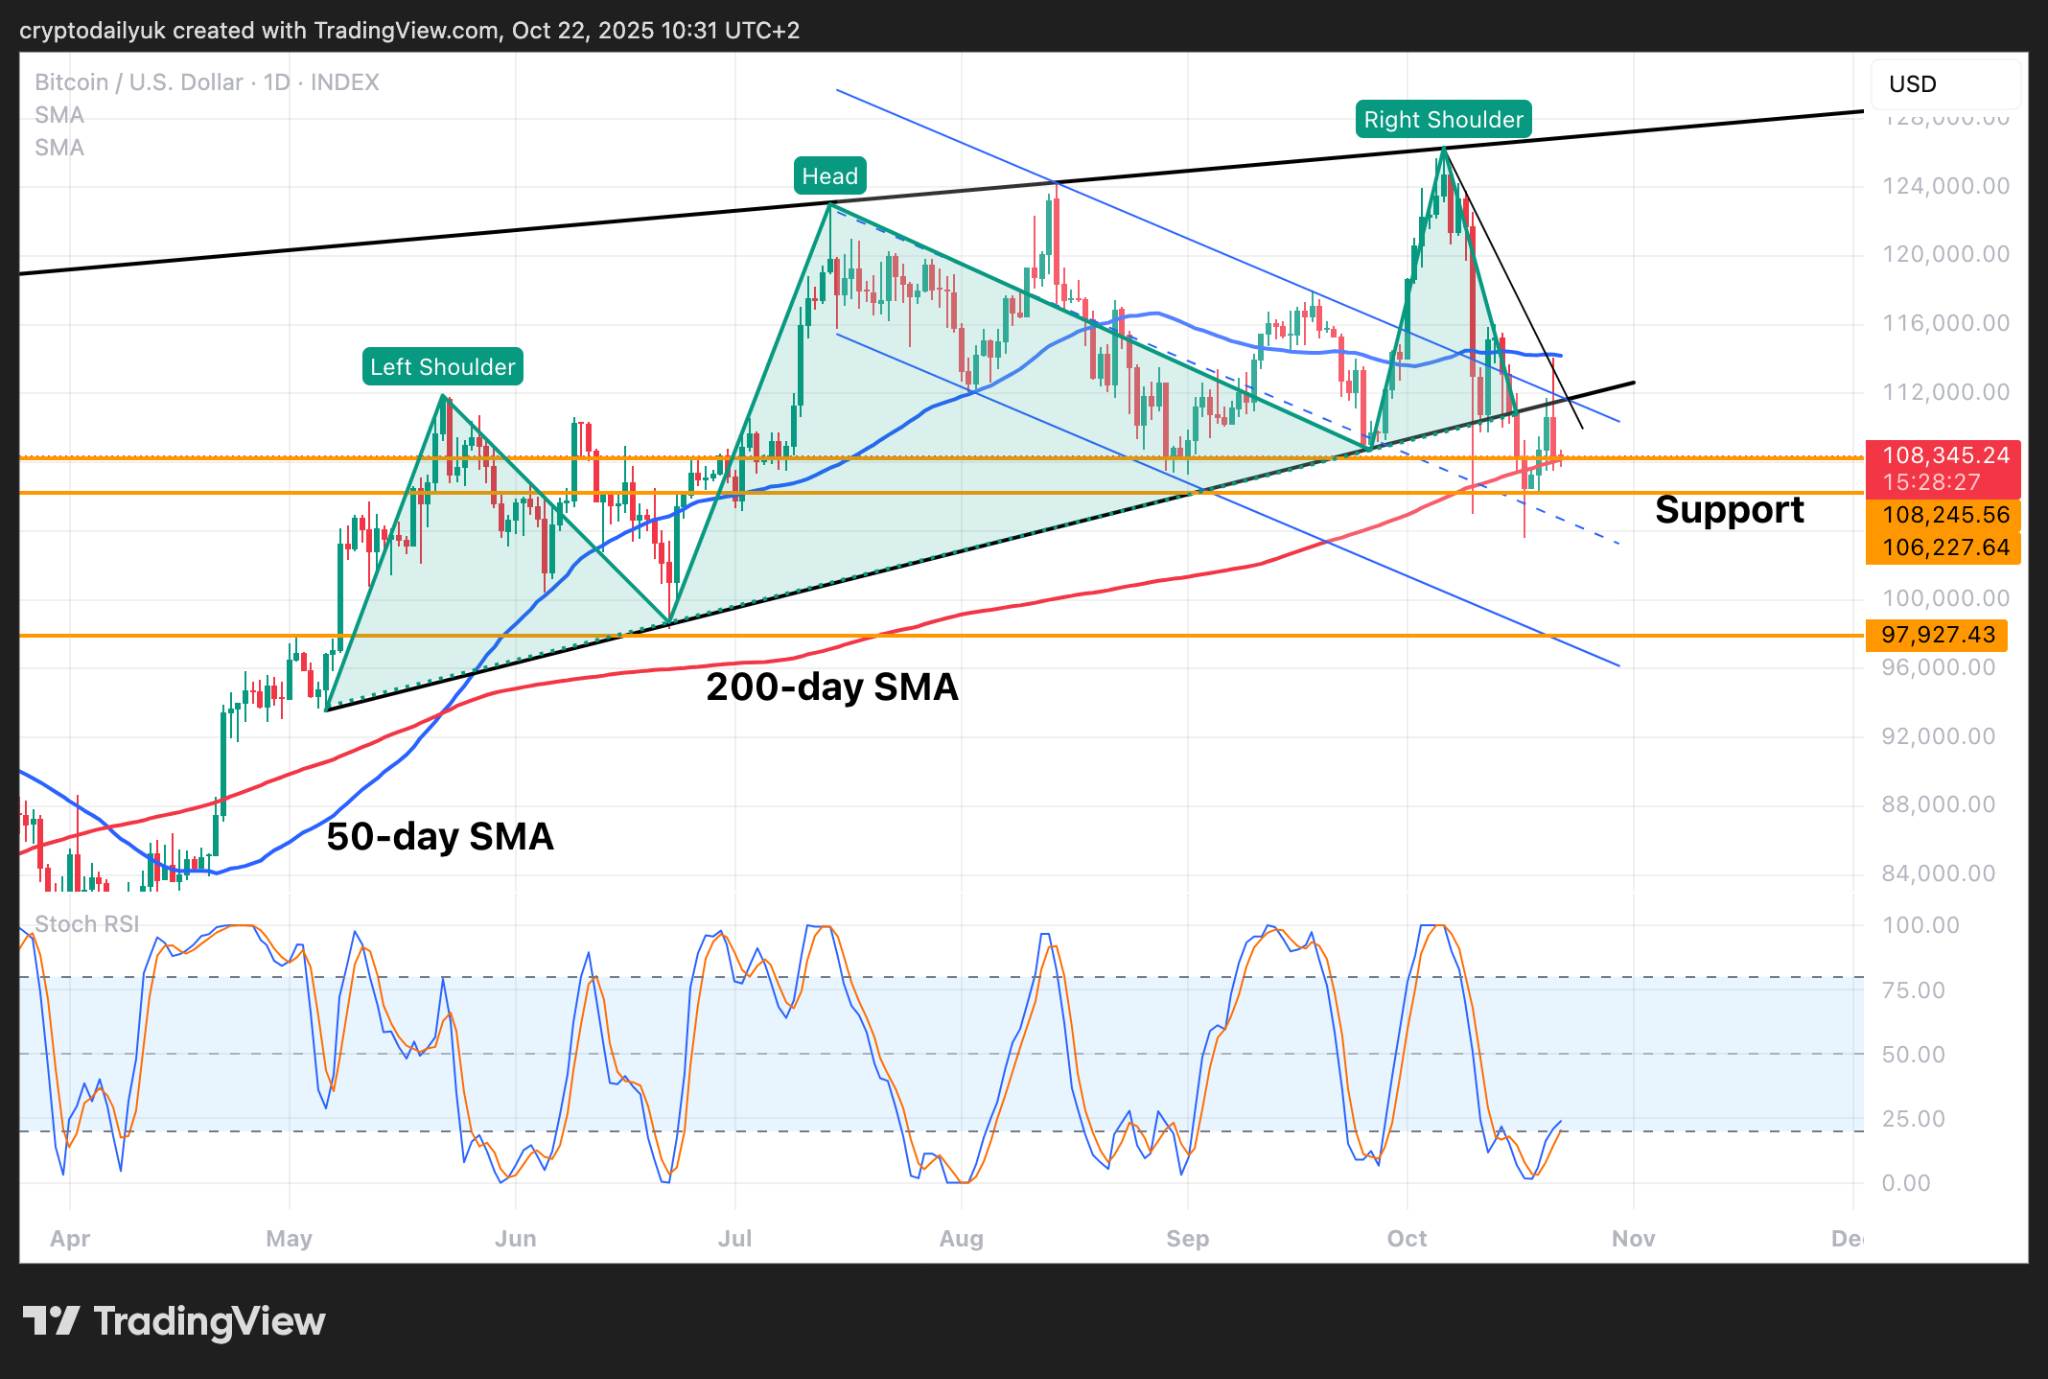 ,
indicate that the recent upward trend stopped at the 50-day moving average. Currently, the 200-day moving average provides support. Nevertheless, the most notable feature on the daily chart is a large head-and-shoulder pattern. Was Tuesday’s increase merely a confirmation of this pattern? Prices have already fallen below the neckline, and now they are rebounding, confirming the bearish pattern.
,The head-and-shoulder top has reached $88,000.
,, 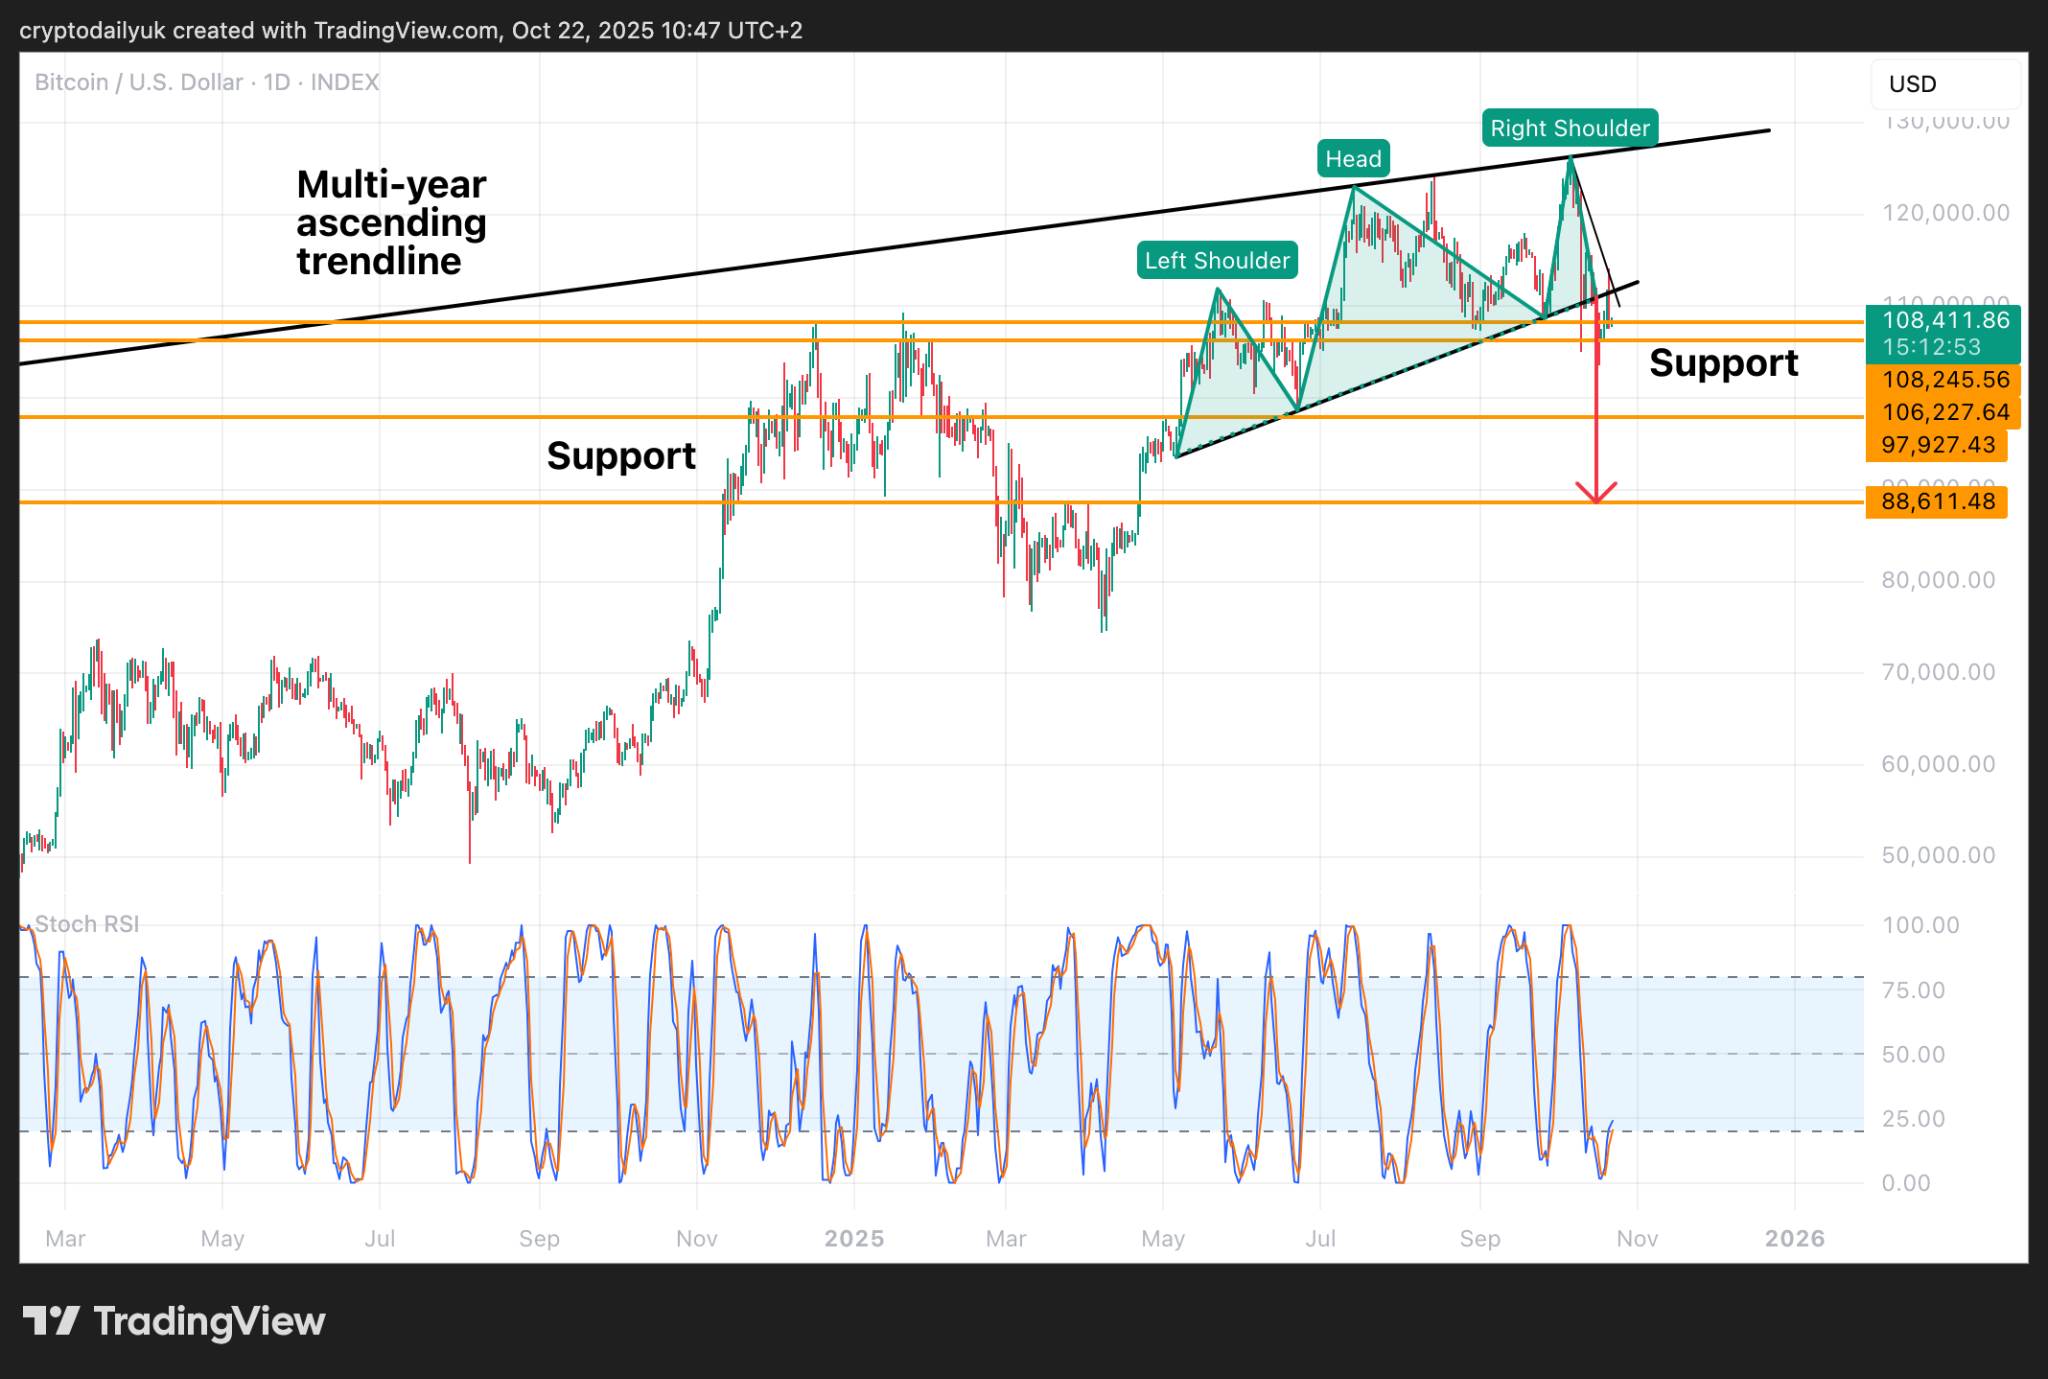 ,
Upon closer inspection, we can see measurable fluctuations in the head-and-shoulder pattern. This suggests that Bitcoin prices could drop further to $88,000. This aligns perfectly with strong support levels. Could this be Bitcoin’s next move? If so, it might be the first step towards a bear market.
,The bullish parabolic trend is about to fail—only one chance remains.
,, 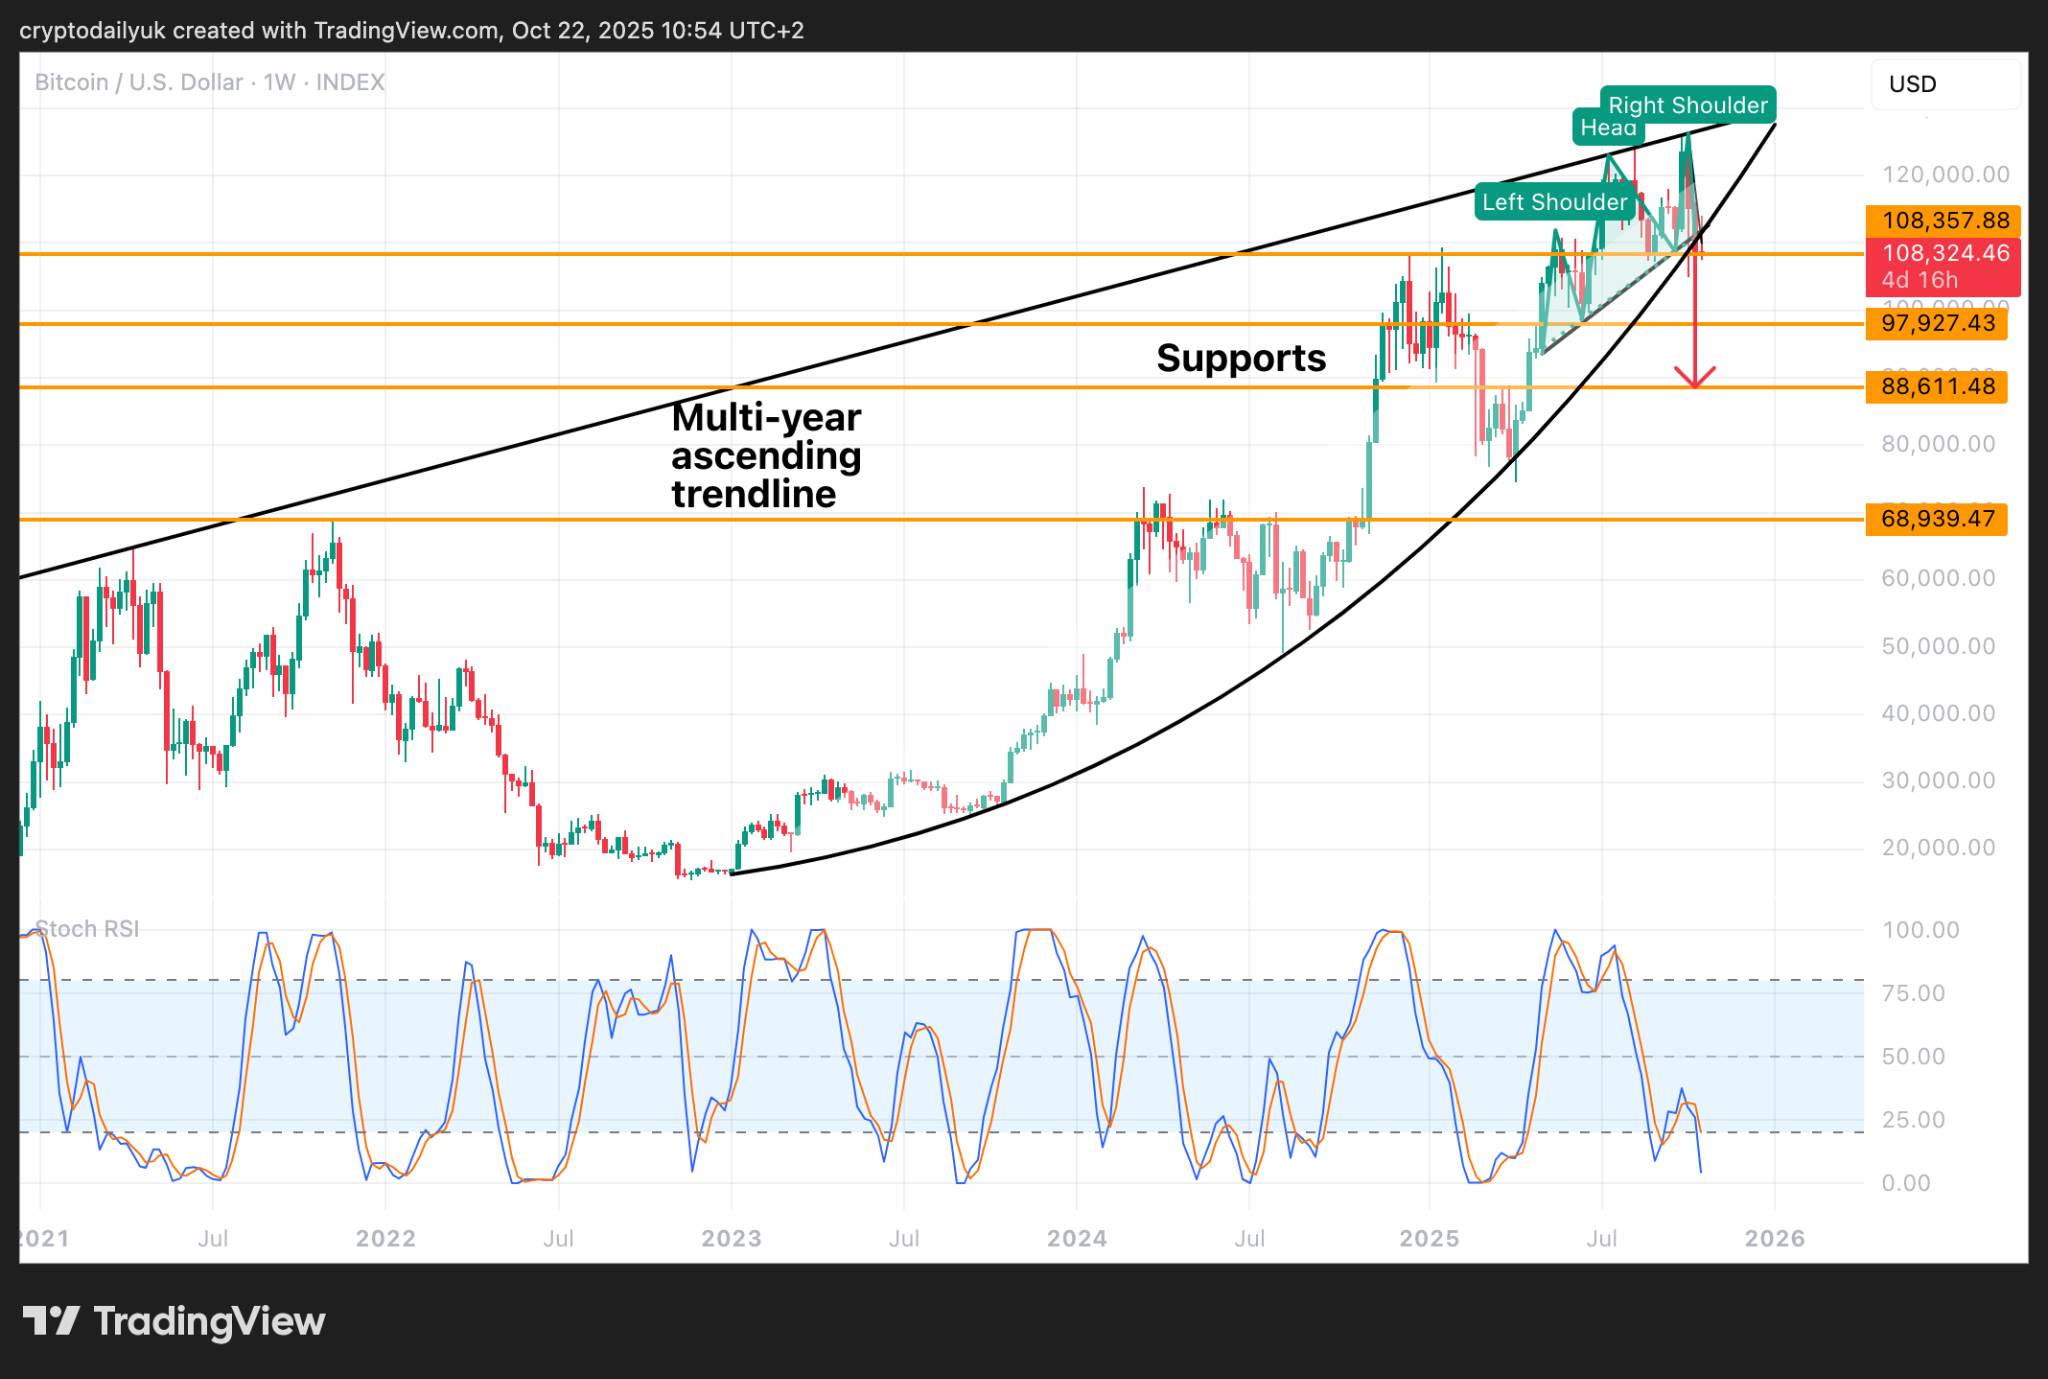 ,
The above weekly chart may be the most critical one since the start of the bull market in January 2023. The price movements shown in the chart are not promising. The head-and-shoulder pattern was confirmed at the worst possible time—right where the bullish parabolic trend might have been broken. So far, the parabolic trend has held, but it must be noted that if this trend breaks, the bull market is likely to collapse as well, especially if the head-and-shoulder pattern continues to hold.
,There is only one hope left in this current Bitcoin bull market: the random RSI indicator shown on the weekly chart. By the beginning of next week, these indicators are expected to reach their bottom. If they can quickly rebound and indicate upward momentum, then this downward trend might actually be just a false breakout. The chances of a real rebound are low, and it needs to happen quickly. The fate of this bull market remains uncertain.