Exchange Ranking
 Top Exchanges
 24h Volume Ranking
 Popularity Ranking
 Exchange BTC Balance
 Proof of Reserves
 Decentralized Exchanges
 Funding Rate
 Funding Heatmap
 Liquidation Data
 Max Pain
 Long/Short Ratio
 Whale L/S Ratio
 Binance/Okex/Huobi L/S
 Bitfinex Margin L/S
 ETF Tracker
 Solana ETF
 XRP ETF
 Hong Kong ETF
 Bitcoin Treasuries
 Crypto Reversal
 Ethereum Reserves
 HyperLiquid Wallet Analysis
 Hyperliquid Whale Watch
 Large Transactions
 On-chain Movement
 Bitcoin ROI
 Stablecoin Market Cap
 Options Analysis
 News
News Articles
 Economic Calendar
 Features
 Wallet
 Contract Calculator


 Security
 Collections
 Watchlist
 Following
 HYPE
HYPE Hyperliquid bought back and destroyed 9,730 HYPE units, with a lifetime destruction of 48.42 million units.
HYPE's current trading price is close to US$86.85, the key resistance level is in the range of US$88.39 to US$90, and the short-term support level is US$83.59 at the 50-day moving average. Trader "watershedpath" still holds leveraged HYPE positions of more than US$30 million after accumulating approximately US$62.7 million in gains.
In the past 24 hours, Hyperliquid destroyed $829,500 worth of HYPE tokens, while Arkham tracking data showed the transaction generated $62.7 million in revenue. Onchain Lens reported that 9,730 HYPEs were purchased and destroyed at an average price of US$85.27, raising the total number of HYPEs destroyed over life to 48.42 million. Meanwhile, trader "watershedpath" continues to maintain its leveraged positions worth more than $30 million.
Hyperliquid destroys 9,730 HYPE tokens Details
According to Onchain Lens, Hyperliquid purchased 9,730 HYPE tokens in the past 24 hours and immediately destroyed them. The average purchase price was US$85.27, and the transaction total was approximately US$829,500. This destruction brought the total number of HYPE removed through this process to 48.42 million.
Based on current market value, the value of these destroyed tokens is approximately US$4.14 billion. This destruction amount accounted for 4.84% of HYPE's maximum supply. Since the purchase occurred around $85.27, the price is very close to the current market price of the token.
Traders lock in US$62.7 million in HYPE gains
The Arkham report showed that trader "watershedpath" achieved a gain of $62.7 million after holding a long position in HYPE for more than a year. However, according to Arkham, the trader did not close the position. Instead, the data showed that the trader continued to withdraw margin from the position.
Currently, the account holds a risk exposure of approximately US$30 million under 4 times leverage. This position comes against the backdrop of HYPE's sharp rise since March. The strong price trend also sent the token to recent chart highs.
HYPE tests US$88 resistance after rebound
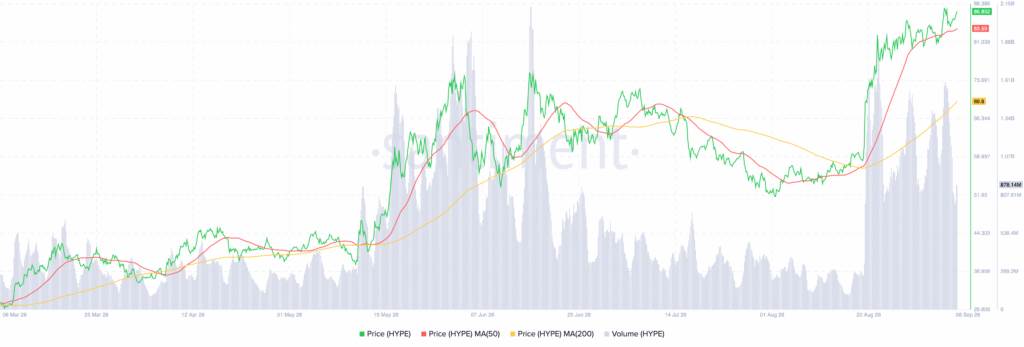
The chart shows that HYPE traded mainly in the US$30 to US$45 range from March to May, followed by a sharp rise. Token prices broke through the $70 mark, but experienced corrections in June and July. It is worth noting that HYPE accelerated again in late August.
The token rose from around $58 to $60 to above $80 on August 20, reaching a high of about $88.386. HYPE is currently trading close to $86.852, so $88 to $90 has become an immediate resistance area. The 50-day moving average (MA50) is at $83.59, while the 200-day moving average (MA200) is close to $69.60.
Trading volume also expanded, reaching approximately $878.14 million in the latest wave of gains. At the same time, HYPE prices are still above the two moving averages. If we can break through US$88.386, the next target will be US$90; but if we fall below US$83.59, we need to pay attention to the support in the US$80 to 78 range.