Exchange Ranking
 Top Exchanges
 24h Volume Ranking
 Popularity Ranking
 Exchange BTC Balance
 Proof of Reserves
 Decentralized Exchanges
 Funding Rate
 Funding Heatmap
 Liquidation Data
 Max Pain
 Long/Short Ratio
 Whale L/S Ratio
 Binance/Okex/Huobi L/S
 Bitfinex Margin L/S
 ETF Tracker
 Solana ETF
 XRP ETF
 Hong Kong ETF
 Bitcoin Treasuries
 Crypto Reversal
 Ethereum Reserves
 HyperLiquid Wallet Analysis
 Hyperliquid Whale Watch
 Large Transactions
 On-chain Movement
 Bitcoin ROI
 Stablecoin Market Cap
 Options Analysis
 News
News Articles
 Economic Calendar
 Features
 Wallet
 Contract Calculator


 Security
 Collections
 Watchlist
 Following
 BTC
BTC  PUMP
PUMP Pump.Fun 价格预测:关键反转背后的技术分析与市场动态
这种剧烈的反转正是当前 Pump.Fun 价格预测备受关注的核心原因,因为 PUMP 正在测试此前的突破是否能够有效维持。Pump.Fun 最初作为一个建立在 Solana 网络上、以快速低成本代币创作为核心的平台推出,随后引入了其原生代币 PUMP。此后,尽管自首次亮相以来价格一直波动不定,但 PUMP 已成为与更广泛的模因币(Memecoin)发射生态系统相关的交易最活跃的代币之一。
$PUMP 目前交易价格接近 $0.003613,过去 24 小时内下跌了 3.1%。在此期间,价格在 $0.003467 至 $0.003732 之间波动,表明即使在最近的通道突破后,Pump.Fun 今日的价格走势依然震荡不已。
Pump.Fun 实时市场数据
指标数值 价格$0.003613 24小时变化-3.1% 24小时范围$0.003467 - $0.003732 市值$16.92亿 完全稀释估值 (FDV)$30.12亿 24小时交易量$1.025亿 锁仓总价值 (TVL)$3.326亿 流通供应量4686.78亿 总供应量8341.82亿 最大供应量1万亿 数据来源:根据 CoinGecko 提供的 PUMP 市场数据,截至 2026 年 9 月 14 日。不同追踪网站的数据可能存在细微差异。
Pump.Fun 清算数据
Time frame Total clearing amount Long clearing short clearing 1 hour $6,140 $5,850 $288.67 4 hours $12,730 $6,650 $6,080 12 hours $1.38 million $1.34 million $47,210 24 hours $1.64 million $1.59 million $49,660 Data source: According to clearing data provided by CoinGlass, as of September 14, 2026.
Clearing data shows that long clearing dominates in various time frames. In the past 24 hours, US$1.59 million of the US$1.64 million in liquidation came from long positions, compared with only US$49,660 on the short side. The 12-hour window showed a more serious imbalance, with $1.34 million of the $1.38 million liquidation hit long traders.
This kind of unilateral liquidation usually occurs when prices fall sharply below the support zone, forcing leveraged buyers to liquidate their positions before attempting to rebound. The massive long liquidations in the past 12 to 24 hours are highly consistent with PUMP's decline along the downtrend channel before its recent breakthrough attempt.
Pump.Fun Exchange Trading Volume
Futures trading volume of PUMP tokens is still concentrated on the two major exchanges. Binance led the way with $105.1 million in 24-hour trading volume, followed by OKX with $89.61 million and Hyperliquid with $42.8 million. 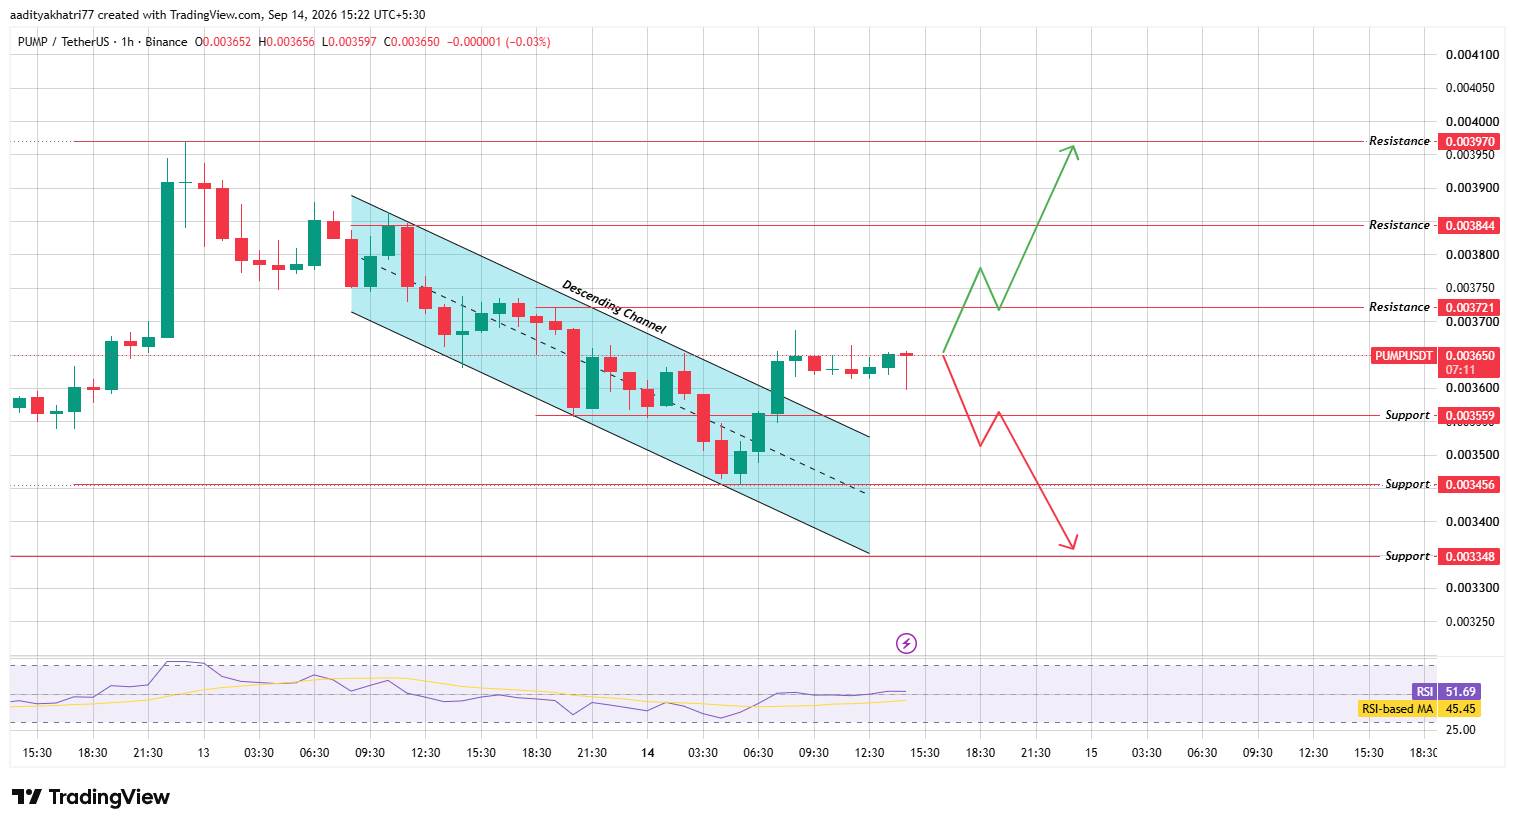 Image source: VolumeHeatmap data is taken from CoinGlass, as of September 14, 2026.
Platforms such as BingX, WhiteBIT, Bitget, KuCoin and Gate contribute small transaction volumes, which together constitute a fairly broad distribution of activity. This level of turnover shows that PUMP's news and price fluctuations have attracted continued attention from centralized and decentralized platforms, even if there is no single big news driving today's market.
Pump.Fun Price Forecast: Technical Analysis
At the hourly chart level, PUMP has traded in the downtrend channel over the past day, a downtrend structure formed by two parallel trend lines that slope downward. Prices broke through the upper boundary of the corridor in the final hours and are currently consolidating near the top of that boundary, at approximately $0.003650.
The Relative Strength Index (RSI) is at 51.69, with a moving average of 45.45, indicating that momentum has turned neutral to slightly positive after the reversal. Whether this breakthrough can be sustained is a key issue in Pump.Fun's 2026 price forecast outlook in the next few trading sessions.
Can $PUMP continue to break through the rally?
If PUMP remains above the former channel boundary and volume increases, the price may move first to $0.003721. Once a breakthrough is confirmed,$0.003844 will become the target, and continued strength may extend the rebound to $0.003970.
What happens if $PUMP loses this breakthrough level?
If you are refused to fall back into the channel, the pattern will change. Losing the $0.003650 area under heavy volume conditions may cause $PUMP to fall back to $0.003559. A deeper correction may cause the decline to extend to $0.003456 and eventually hit $0.003348.
Support and Resistance
Support Resistance $0.003559 $0.003721 $0.003456 $0.003844 $0.003348$0.003970 Bull Market, Benchmark and Bear Market Scenarios
Scenario Setting Conditions Target Level Bullion Prices Hold Breakthrough Level With Heavy Volume $0.003721-$0.003970 Benchmark Prices Consolidate Near the Boundary of the former channel $0.003559-$0.003721 Bear Market Prices Fall Back Inside the Falling Channel $0.003348 Pump.Fun vs. Bitcoin Comparison
The price of Pump.Fun tends to show higher volatility than Bitcoin, reflecting its smaller market cap size and its association with the launch cycle of memein on the Solana network. When Bitcoin remains stable, tokens like PUMP usually have more room to test breakthroughs, such as the one currently underway. Given that leveraged positions on PUMP have been quickly liquidated in the past day, Bitcoin's rapid decline is likely to put pressure on PUMP's breakthrough levels faster than any news about pump.fun tokens.
Methodology
This Pump.Fun price forecast is based on the PUMP/USDT hourly chart provided by Binance via TradingView, using the falling channel structure, RSI readings, and marked support and resistance levels as the main technical indicators. Clearing and exchange volume data comes from Coinglass, while market data such as prices, market capitalization and supply comes from CoinGecko. This Pump.Fun 2026 price forecast outlook only reflects the current technical situation, and no level discussed herein should be regarded as a guarantee.
Expert views
Market commentators who are concerned about PUMP's recent price trend generally point out that channel breakthroughs after a large number of long liquidations usually require retesting the breakthrough level before continuing to rise. Several traders focusing on meme-related tokens pointed out that PUMP's current trend must remain above the former channel boundaries to avoid slipping back into the downward trend it has just escaped.
Disclaimer : This article is for reference only and does not constitute financial advice. Cryptocurrency markets (including Pump.Fun) are highly volatile and prices may conflict with any technical layout we discuss here. Support and resistance levels are not guaranteed to be effective, and actual price movements may go far beyond the depicted scenario. Readers should conduct independent research and consult a licensed financial adviser before making any investment decisions.