Exchange Ranking
 Top Exchanges
 24h Volume Ranking
 Popularity Ranking
 Exchange BTC Balance
 Proof of Reserves
 Decentralized Exchanges
 Funding Rate
 Funding Heatmap
 Liquidation Data
 Max Pain
 Long/Short Ratio
 Whale L/S Ratio
 Binance/Okex/Huobi L/S
 Bitfinex Margin L/S
 ETF Tracker
 Solana ETF
 XRP ETF
 Hong Kong ETF
 Bitcoin Treasuries
 Crypto Reversal
 Ethereum Reserves
 HyperLiquid Wallet Analysis
 Hyperliquid Whale Watch
 Large Transactions
 On-chain Movement
 Bitcoin ROI
 Stablecoin Market Cap
 Options Analysis
 News
 Articles
 Economic Calendar
 Features
 Wallet
 Contract Calculator


 Security
 Collections
 Watchlist
 Following
 FLOKI
FLOKI rebounded from a low of $0.00001966 and built a higher low before approaching the main resistance level in the $0.000030 area.
The RSI indicator is at 62.77, and the MACD shows a slight positive value, indicating that momentum is improving, but so far, neither indicator has signaled that the market is overbought. Support is seen around $0.000028 and the uptrend line, while resistance is around $0.00030 and $0.00003131.
FLOKI has shown a planned recovery after a long period of weakness, with higher lows and stronger K-lines pushing prices into important resistance areas that the market is testing after a multi-stage recovery.
Building recovery from low ranges
Crypto GVR described the price rise from $0.000020 to $0.00031 as a reactivation of momentum. This increase represents a recovery of about 55% from the low range. The weekly structure shows a stronger K-line emerged after a long period of weakness.
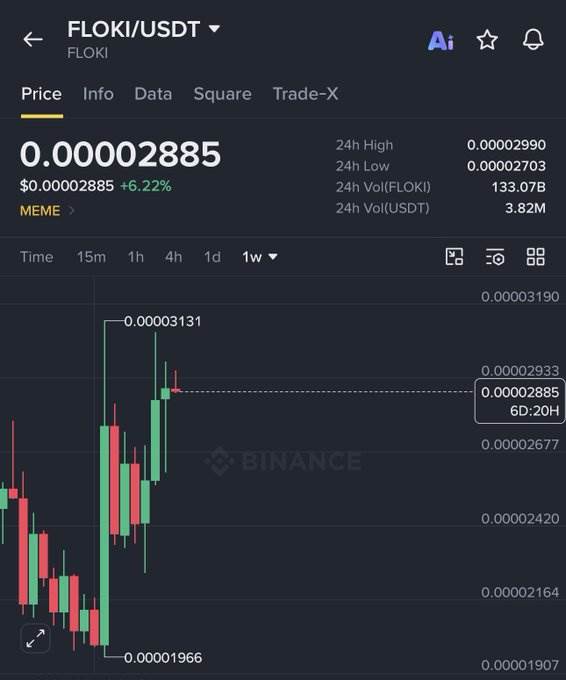
Previous declines had pushed prices into the $0.0001966 region. This level is the lowest visible point in the weekly structure shown. Subsequently, buyers began to absorb selling pressure in the low range.
The rally gained momentum after breaking through $0.0002164, reaching $0.0002420. The price then broke through $0.00002677, forming consecutive higher recovery lows. This trend eventually pushed prices into resistance at $0.00002933.
As of writing, FLOKI is trading at approximately $0.00002885, approximately 6.22% higher than the previous price. The highest price displayed in 24 hours is $0.00002990 and the lowest price is $0.0002703. Trading volume showed close to $3.82 million (USDT).
Daily structure shows higher lows
Daily chart shows prices have experienced a prolonged consolidation between $0.00020 and $0.00022. Then the scope suddenly expanded around August 20. Since then, the price rebounded sharply to $0.000030, and then entered another period of consolidation.
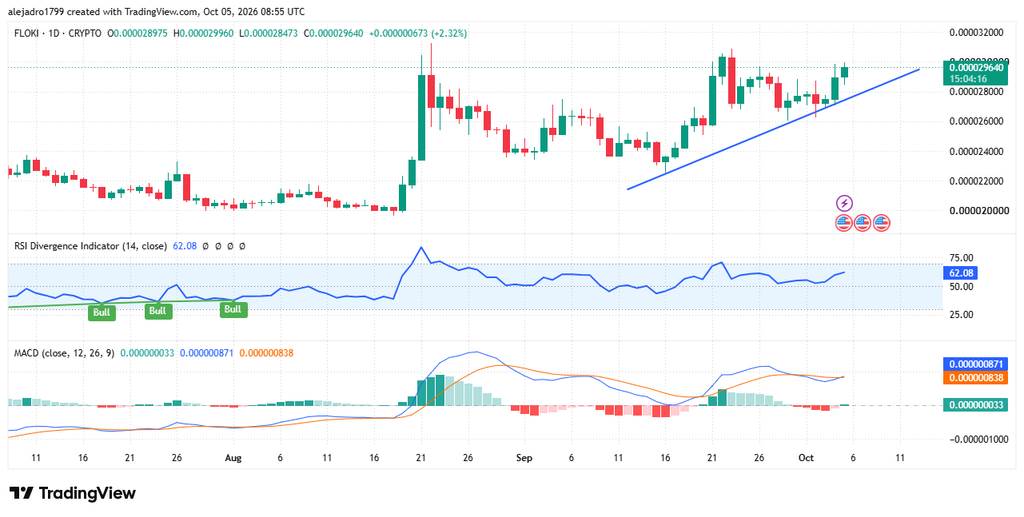
Subsequent pullbacks hit approximately $0.00024, but did not reach the pre-revision consolidation range. September produced a series of gradually rising lows. An upward trend line now connects several of the recovery lows.
The recent K-line has once again returned to the resistance zone of $0.00030. Several previous reactions in the region have made it an important barrier. Any trading day that closes above this level will further consolidate the emerging recovery trend.
The next upward price support is around $0.00032. This level marks the upper boundary of the daily chart provided. Continued breakthroughs at this level will extend the series of higher recent highs.
Momentum indicators support recovery
As of writing, the RSI on the daily time frame shown is 62.77. It remains above the neutral value of 50, but below the traditional threshold of 70. As a result, kinetic energy increased but did not reach extreme readings.
The MACD line is still above the signal line in the chart. The histogram also slightly returns to the positive area. However, smaller histogram readings indicate a moderate improvement in kinetic energy.
The rising trend line remains a key structural reference below prices. Staying above it will preserve the sequence of higher lows. A break below this trend line may re-expose the $0.000026 to $0.00027 area.
In addition,$0.00028 provides nearby support. Above it, the main resistance levels remain at $0.000030 and $0.0003131. So FLOKI entered another test with improved momentum, but the confirmation signal was still waiting.