Exchange Ranking
 Top Exchanges
 24h Volume Ranking
 Popularity Ranking
 Exchange BTC Balance
 Proof of Reserves
 Decentralized Exchanges
 Funding Rate
 Funding Heatmap
 Liquidation Data
 Max Pain
 Long/Short Ratio
 Whale L/S Ratio
 Binance/Okex/Huobi L/S
 Bitfinex Margin L/S
 ETF Tracker
 Solana ETF
 XRP ETF
 Hong Kong ETF
 Bitcoin Treasuries
 Crypto Reversal
 Ethereum Reserves
 HyperLiquid Wallet Analysis
 Hyperliquid Whale Watch
 Large Transactions
 On-chain Movement
 Bitcoin ROI
 Stablecoin Market Cap
 Options Analysis
 News
News Articles
 Economic Calendar
 Features
 Wallet
 Contract Calculator


 Security
 Collections
 Watchlist
 Following
 BTC
BTC Bitcoin holds on to key support levels, with resistance from its long target of US$79,000
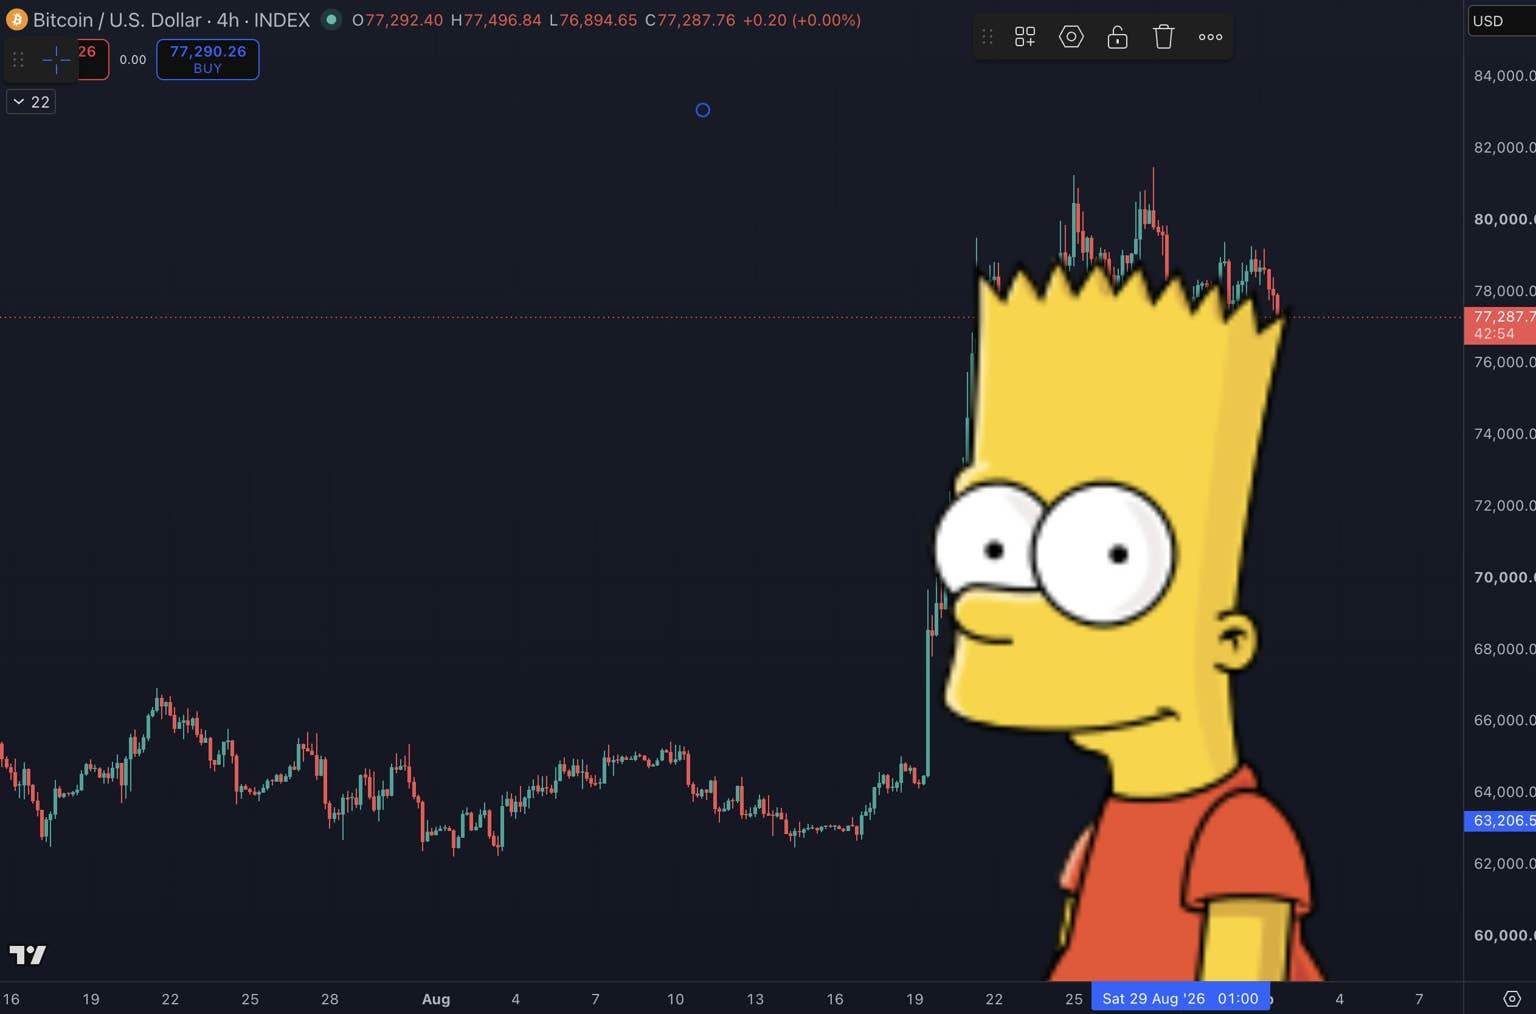
Bitcoin prices are currently hovering in the US$77,000 to US$78,000 range, and traders are closely watching the key support areas to see whether the latest consolidation is coming to an end. The one-hour and four-hour charts show that BTC is compressing below the resistance level, and the bullish breakout trend remains intact as long as prices do not break below the support and open up downside to $73,000 to $75,000.
analyst Follis believes that Bitcoin's current position is not attractive to establish new short positions. He pointed out that BTC is trading directly within established support areas. The one-hour chart shows buyers repeatedly defending the lower edge of the recent range, while resistance continues to suppress the rebound to around $79,000.
Key Price Analysis: US$77,000 Support and US$79,000 Resistance
Data captured in the chart shows that the Bitcoin price was approximately US$77,160 in the early morning of September 3, slightly above the horizontal support area of US$76,800 to US$77,000. Since late August, the region has triggered price reactions multiple times, becoming a key level that bulls must defend immediately.
Thechart also highlights multiple rejections around $79,100 to $79,300. BTC tested this resistance level three times but failed to establish a sustained breakthrough, creating a well-defined range between support near $77,000 and resistance above $79,000.
Short-term price trends have also formed a structure that tilts towards support. If buyers continue to defend the bottom of the range and BTC breaks this local downward trend, the path predicted by the chart will point to another challenge for $79,000. Decisively breaking through these repeated highs will provide stronger confirmation for buyers to regain control of the market. Until then, bullish arguments still depend on whether Bitcoin can maintain a low support boundary. A sustained break below this region will negate the recent rebound setting and increase the risk of a deep correction.
Triangle pattern may signal a strong fifth wave of gains
Analyst "Freedom By 40" is focusing on a larger four-hour triangle pattern, which may represent the fourth wave in Bitcoin's rise (Wave 4). In this scenario, the tightening consolidation will be corrective rather than the beginning of a larger bearish trend, which could lay the foundation for a stronger Wave 5 movement once the triangle pattern is resolved.
The four-hour chart shows that BTC's price of approximately US$77,789 is within the convergent trend line. The upper boundary slopes downward from the US$80,000 region, while the lower boundary continues to rise, providing continued support in the mid-to-high region of US$76,000 to US$77,000.
Morphological structure and key failure points
The structure is marked as an A-B-C-D-E triangle, and the current sequence may be heading towards the completion of the fourth wave. If Bitcoin breaks through the downward upper trend line and confirms that buyers have taken over the market, this analysis will favor a new round of upward movement.
The chart points to US$76,223 as a particularly important level. Holding above this point will preserve the triangular interpretation and keep the bullish fifth wave scenario active. This point also provides a clear point of failure. "Freedom By 40" said that if the price falls below the level shown by the green line, the possibility of a triangular shape will be reduced and a flat correction structure will be shifted, which may cause Bitcoin to fall to the $73,000 to $75,000 region before trying to recover again.
As a result, Bitcoin is still subject to clear technical levels. Holding the $76,000 to $77,000 range and breaking through $79,000 will strengthen bullish arguments; while losing the $76,223 line of defense will shift market attention to deeper support at $73,000 to $75,000.