Exchange Ranking
 Top Exchanges
 24h Volume Ranking
 Popularity Ranking
 Exchange BTC Balance
 Proof of Reserves
 Decentralized Exchanges
 Funding Rate
 Funding Heatmap
 Liquidation Data
 Max Pain
 Long/Short Ratio
 Whale L/S Ratio
 Binance/Okex/Huobi L/S
 Bitfinex Margin L/S
 ETF Tracker
 Solana ETF
 XRP ETF
 Hong Kong ETF
 Bitcoin Treasuries
 Crypto Reversal
 Ethereum Reserves
 HyperLiquid Wallet Analysis
 Hyperliquid Whale Watch
 Large Transactions
 On-chain Movement
 Bitcoin ROI
 Stablecoin Market Cap
 Options Analysis
 News
News Articles
 Economic Calendar
 Features
 Wallet
 Contract Calculator


 Security
 Collections
 Watchlist
 Following
 BTC
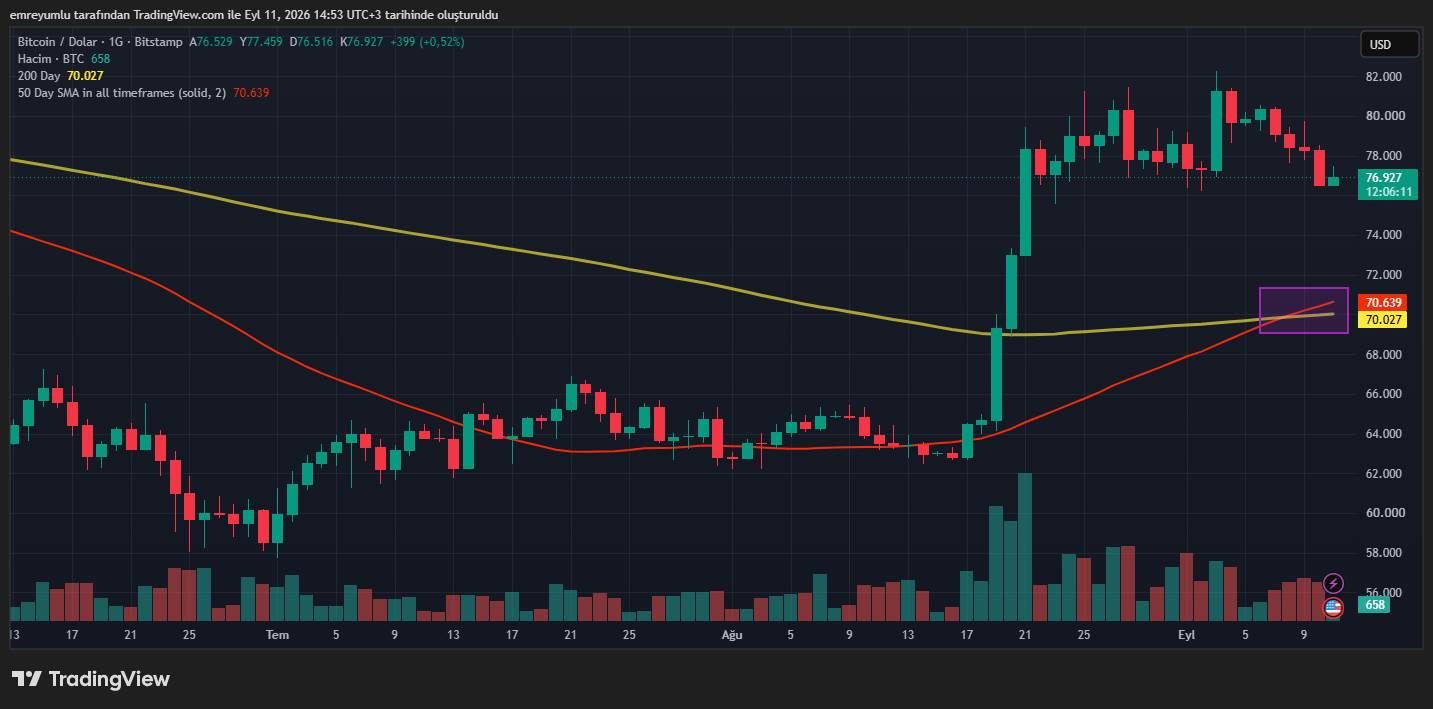
BTC Bitcoin's "golden cross" signal reappeared this week, but price movements have not yet verified the expected rise predicted by the indicator. This technical pattern is formed when the 50-day moving average crosses the 200-day moving average, and has traditionally been regarded as a leading indicator of long-term upward trends. Currently, the price of Bitcoin is at around US$76,900.
The gold cross is not a guarantee of rise
The gold cross itself does not guarantee a price rise. Looking back at the historical price trend of Bitcoin, we can find that most of the upstarts often occur before the cross signal appears; after the signal appears, prices sometimes experience short-term corrections. Recent trends are also highly similar to this historical behavior: Bitcoin rose from $62,000 to $82,000 before the gold cross formed. When the pattern was established at the beginning of the week, BTC prices were around US$80,000 before falling back into the US$77,000 range.
Why is the gold cross a lag signal for Bitcoin?
The gold cross is formed when the 50-day moving average breaks through the 200-day moving average. As a result, investors often view it as a technical confirmation of a strong uptrend. However, since both moving averages are calculated based on historical price data, this indicator has a lagging nature. In other words, the gold cross will not form until the market enters a rising phase, which means that prices may have risen significantly by the time the signal appears.
This situation shows that there is a risk in trading based on form only in the cryptocurrency market. Traders conducting technical analysis should comprehensively evaluate price support and resistance levels, trading volume and overall market structure.
What is the trend of Bitcoin after the gold cross in 2021?
Bitcoin's historical performance provides several high-profile examples of post-gold crossover pullbacks. In 2021, the price of BTC will increase from approximately US$35,000 in July to reaching around US$52,000 in September. After this round of gains, a gold cross signal was formed. However, the emergence of this technical signal did not prompt Bitcoin to continue to rise, but the price fell back to about $40,000.
A similar situation occurred in early 2023. Bitcoin prices rose from $16,000 to $23,000 and formed a gold cross in February. Subsequently, the price retreated to approximately $20,000 in March.
What do the 2024 and 2025 cases reveal?
Another similar behavior occurred in October 2024. Before the gold cross formed, Bitcoin rose from $54,000 to $70,000. After the pattern was established, BTC prices fell back to about US$67,000 as November approached.
A more recent case occurred in 2025. Bitcoin bottomed out at around $76,000 in April and rose to around $110,000 in May. After the gold cross formed, prices corrected again, falling to about $100,000 in late June. These examples show that while this pattern is a positive signal in the long run, it does not eliminate short-term correction risks.
What key points of Bitcoin should we pay attention to at present?
In the current situation, Bitcoin is trading at around US$76,900, raising questions about whether the correction after the gold cross will continue. Historical cases show that if prices experience a strong rise before patterns are formed, prices may rest in the short term. Therefore, investors should not directly expect a rise just because of the gold cross. This pattern should be seen more as a tool to judge long-term trends, while short-term trends need to separately track the specific response of prices.
Bitcoin's correction after the gold crosses in 2021, 2023, 2024 and 2025 does not guarantee that the current trend will produce the same results. However, these cases clearly illustrate why the indicator should be treated as a lagging signal.
This content does not constitute any investment advice. Markets contain high risks, so please conduct independent research before making investment decisions.