Exchange Ranking
 Top Exchanges
 24h Volume Ranking
 Popularity Ranking
 Exchange BTC Balance
 Proof of Reserves
 Decentralized Exchanges
 Funding Rate
 Funding Heatmap
 Liquidation Data
 Max Pain
 Long/Short Ratio
 Whale L/S Ratio
 Binance/Okex/Huobi L/S
 Bitfinex Margin L/S
 ETF Tracker
 Solana ETF
 XRP ETF
 Hong Kong ETF
 Bitcoin Treasuries
 Crypto Reversal
 Ethereum Reserves
 HyperLiquid Wallet Analysis
 Hyperliquid Whale Watch
 Large Transactions
 On-chain Movement
 Bitcoin ROI
 Stablecoin Market Cap
 Options Analysis
 News
News Articles
 Economic Calendar
 Features
 Wallet
 Contract Calculator


 Security
 Collections
 Watchlist
 Following
 XRP
XRP XRP is still below US$1.56 after recovering the range, and the breakthrough level has become the core of the current market structure.
If it can continue to exceed US$1.56, market attention will turn to US$1.70, US$1.80 and the chart target of US$2.00. After liquidity was swept up previously, the overall trend is still in a state of range fluctuations, and the current resistance level controls the choice in the next direction.
After experiencing a sharp rebound, the price of XRP is still between the main support level and resistance level. The more macro structure continues to develop within the established range. The recent decline has prompted markets to focus again on nearby short-term support.
XRP is still operating within the established trading range
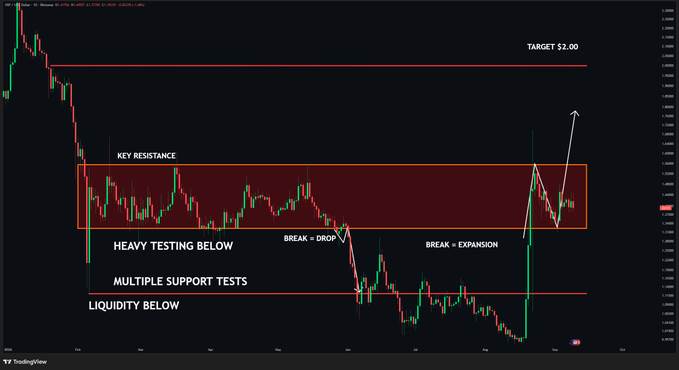
The overall chart shows that XRP is currently trading within the range of US$1.32 to US$1.56. Prices have fluctuated repeatedly between these boundaries for months. During this period, the lower boundary was tested by the seller many times. In the end, the price fell below the $1.32 area for a while and swept away liquidity below. However, this break failed to bring about a sustained decline. Instead, XRP reversed sharply and expanded back into the range. The rally brought prices back into the previously established trading structure and also pushed XRP closer to the upper boundary of the range. However, the $1.55 - 1.56 area remains an unbroken resistance level.
Alex Marzelli described this structure as a "liquidity sweep" and a "range recovery." The analysis also pointed out that the upper border remains a major obstacle. The subsequent target levels confirmed by the analysis are: US$1.70, US$1.80 and US$2.00 respectively.
Source: X
Short-term charts show renewed selling pressure
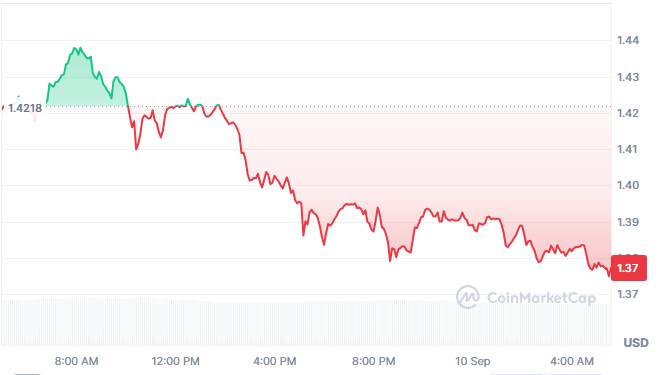
The latest market chart shows a weaker short-term pattern than the macro structure. XRP initially rose to about $1.44, before reversing downward. This refusal to rise resulted in a series of lower highs during the period shown.
Source: Coinmarketcap
Subsequently, the price fell outside the US$1.42 region during the decline. Selling pressure pushed the market to $1.40. Although there have been several rebounds around this level, no lasting recovery has been established. 
The decline continued to extend to US$1.38 before a brief rebound was followed. But these rebounds are limited and limited by nearby resistance levels. As a result, sellers retain control over most intra-day transactions. The current price is around $1.37, putting XRP close to the lower boundary of the period. The latest K-line shows that fluctuations in the region are relatively compressed, indicating that a consolidation pattern has been formed after the recent decline.
The US$1.56 breakthrough remains the main technical trigger point
The macro trend depends on how XRP responds to the US$1.55 - 1.56 resistance level. Once a breakthrough in the area is confirmed, the current interval structure will change. The chart then identified $1.70 as the first higher target.
In the structure shown, the next significant resistance level appears around $1.80. Above that region, the chart sets a larger target of $2.00. As long as no price breakthrough is confirmed, these levels remain forecast.
At the same time, given the previous liquidity sweep, the lower edge of the interval remains important. 1.32 The U.S. dollar area represents the lower boundary of the established structure. If prices continue to fall below the region, it will weaken the current pattern of "range recovery".
Currently, XRP is in a state of tension between short-term weakness and the macro recovery structure. The immediate chart shows support under pressure and resistance high. Therefore, the larger trend depends on the stability of the range and whether it can eventually break through $1.56.