Exchange Ranking
 Top Exchanges
 24h Volume Ranking
 Popularity Ranking
 Exchange BTC Balance
 Proof of Reserves
 Decentralized Exchanges
 Funding Rate
 Funding Heatmap
 Liquidation Data
 Max Pain
 Long/Short Ratio
 Whale L/S Ratio
 Binance/Okex/Huobi L/S
 Bitfinex Margin L/S
 ETF Tracker
 Solana ETF
 XRP ETF
 Hong Kong ETF
 Bitcoin Treasuries
 Crypto Reversal
 Ethereum Reserves
 HyperLiquid Wallet Analysis
 Hyperliquid Whale Watch
 Large Transactions
 On-chain Movement
 Bitcoin ROI
 Stablecoin Market Cap
 Options Analysis
 News
News Articles
 Economic Calendar
 Features
 Wallet
 Contract Calculator


 Security
 Collections
 Watchlist
 Following
 SHIB
SHIB SHIB is still in a convergent form, with support and resistance intertwined
SHIB is still in a tightening consolidation form, with rising support lines and falling resistance lines meeting near the current trading range. Price volatility moderated around $0.0000506, while narrowing Bollinger Bands indicate a decrease in volatility in overall trading activity in the near future. MACD momentum weakened, making prices break through resistance upwards or fall below support downwards, becoming key technical highlights for the subsequent trend of SHIB.
SHIB prices continue to consolidate within the daily-level structure. As the support line rises and the resistance line moves down, the direction is not yet clear. Community attention has returned, but market sentiment has become more rational.
Whales View: The market is slowly awakening, but community resilience remains
"Whales Care" pointed out that SHIB is gradually awakening through a slower market pace. The post also highlighted the continuing community power surrounding the token. The current activity is seen as a gradual development rather than a precursor to a major event. 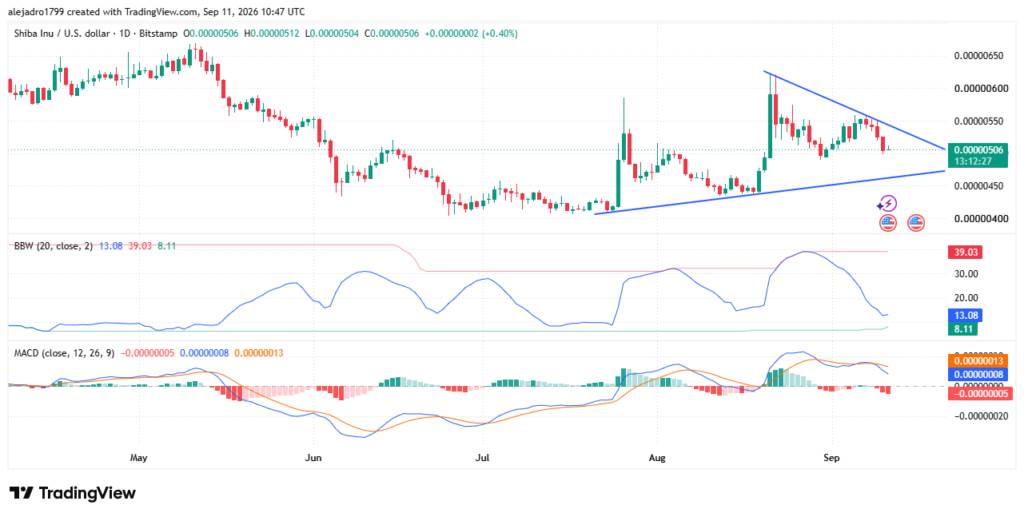
After a daily consolidation, the price of SHIB is approaching the $0.0000506 position on the chart. The price had previously dropped from $0.0000650 to $0.0000430. As buyers build a broader base, selling pressure gradually recedes.
The chart shows that prices began to recover around July after hitting around $0.0000410. Since then, multiple higher lows have formed along the rising support line. This sequence contrasts with the declining resistance line formed after the previous rebound in August.
The most recent K-line remains below the upper trend line extending from the August high. Sellers repeatedly appear near this descending boundary. At the same time, buyers continue to hold on to the rising boundary below.
Bollinger Bands show reduced volatility
This tightening structure is supported by the Bollinger Bands Width Indicator. Its latest reading is around 13.08, having previously reached significantly higher levels. This decline suggests that daily price volatility has shrunk significantly.
This contraction in volatility followed the sharp price expansion during August. The price briefly moved towards approximately $0.0000620 and subsequently fell back into the current consolidation structure. Since then, daily price fluctuations have become increasingly limited.
The current SHIB price lies between two convergent trend lines. The upper boundary provides immediate resistance to any rebound attempt, while the lower boundary provides the nearest structural support needed for continued consolidation.
If the downward resistance can be effectively broken through, the current pattern will be changed. This would show that buyers have overcome the structure that limits the recent rebound. On the contrary, if upward support breaks below, early consolidation lows will come back into focus.
MACD awaits directional confirmation
The momentum provided by MACD is currently weaker than in the previous recovery stage. The latest bar chart on the chart is slightly negative. The MACD line has also penetrated its signal line.
This change followed the strong positive momentum recorded in August. The previous rise was accompanied by an expanding green bar chart and rapid price rises. Recent readings suggest that momentum is fading as prices consolidate.
As a result, the broader chart presents a market waiting for clearer signals of direction. The rising support line continues to protect the recent series of higher lows. At the same time, the falling resistance line limits attempts above.
"Whales Care" perspective fits into this relatively quiet stage of technology. Its description of slow markets is consistent with the low volatility visible on the chart. At present, the next main signal is still a confirmation breakthrough in tightening the structure.