Exchange Ranking
 Top Exchanges
 24h Volume Ranking
 Popularity Ranking
 Exchange BTC Balance
 Proof of Reserves
 Decentralized Exchanges
 Funding Rate
 Funding Heatmap
 Liquidation Data
 Max Pain
 Long/Short Ratio
 Whale L/S Ratio
 Binance/Okex/Huobi L/S
 Bitfinex Margin L/S
 ETF Tracker
 Solana ETF
 XRP ETF
 Hong Kong ETF
 Bitcoin Treasuries
 Crypto Reversal
 Ethereum Reserves
 HyperLiquid Wallet Analysis
 Hyperliquid Whale Watch
 Large Transactions
 On-chain Movement
 Bitcoin ROI
 Stablecoin Market Cap
 Options Analysis
 News
News Articles
 Economic Calendar
 Features
 Wallet
 Contract Calculator


 Security
 Collections
 Watchlist
 Following
 BTC
BTC Ali Charts: Based on a short-term holder cost basis, the potential accumulation area of Bitcoin is at US$71,200
According to analyst Ali Charts, the next buying range for Bitcoin may be around US$71,200. The analyst identified this location as a potential accumulation area. This view was made after Bitcoin fell back from nearly $80,000 to $77,000. At the same time, market data showed short-term bearish momentum, with key support concentrated between $76,500 and $77,000.
Points to a cost base of US$71,200
Ali Charts pointed out that in previous bull cycles, the cost base for short-term holders of Bitcoin has provided valuable buying opportunities. He focused on data from 2022 to 2025, noting that whenever Bitcoin hits or briefly drops below that level, it tends to create a wider range of buying opportunities.
For traders who have not opened positions below US$60,000, he said that although the process of price climbing towards US$77,000 to US$80,000 may be frustrating, he advised not to blindly chase higher prices. Instead, he pointed out that prices could undergo a correction towards the short-term holder cost base (approximately $71,200).
Bear momentum around $77,000
Currently, Bitcoin is trading at around $77,000. The latest K-line opened at US$77,129.47, hitting a high of US$77,138.15, then fell to US$77,000 and closed here, recording a 0.14% decline, reporting zero trading volume.
From September 5 to 7, the Bitcoin price remained in the range of US$79,500 to US$80,000. Previously, Bitcoin briefly broke the $80,000 mark, but then reversed sharply. The decline then hit about $78,000 and sold off again on September 11 into the $76,500 to $76,800 range. The strong rebound that followed pushed BTC to around $79,800, but the trend encountered strong resistance. Since September 12, Bitcoin has mainly fluctuated between $76,900 and $77,500.
Key prices determine the next trend
Technical indicators remain weak. The Relative Strength Index (RSI) was 39.23, below its moving average of 45.82 and a neutral level of 50. However, it is still above the oversold threshold of 30. If the RSI breaks through 50, it indicates that buying pressure has increased.
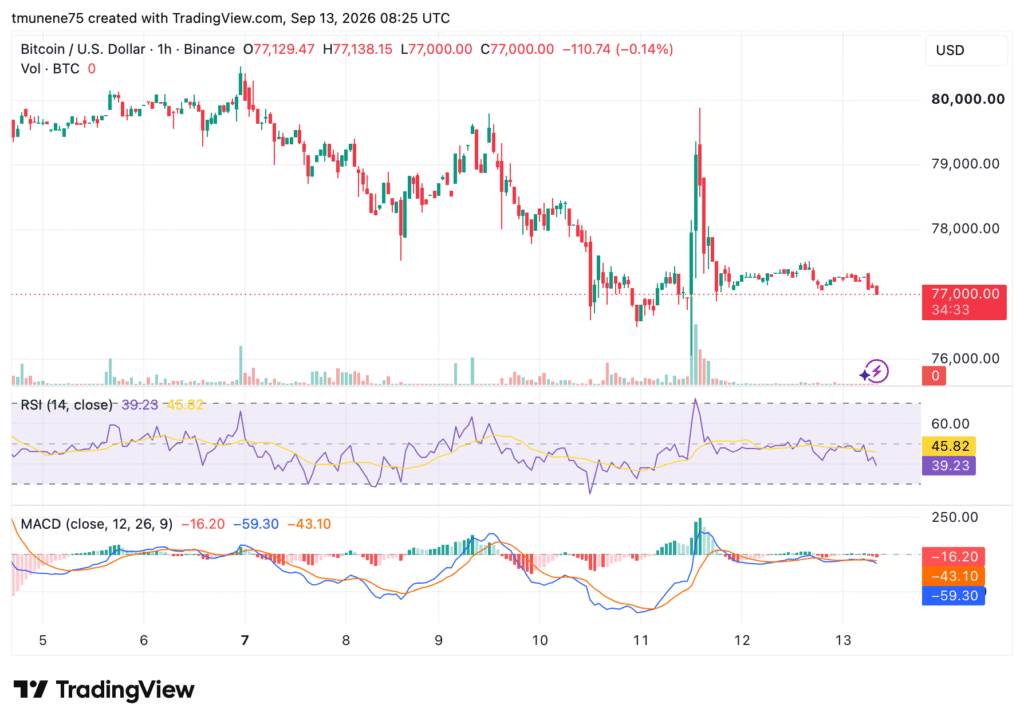
The MACD line is at-59.30, which is lower than-43.10for the signal line. Its histogram reading was-16.20, confirming the recovery of downward momentum after the rebound. The current support range is $76,500 to $77,000, with stronger support around $76,000. Resistance appears in the $77,500 to $78,000 range, followed by $79,000 and $79,800. If we can continue to stand above US$78,000, it will be conducive to market recovery; once we fall below US$76,500, it may expose support levels of US$76,000 and lower.