Exchange Ranking
 Top Exchanges
 24h Volume Ranking
 Popularity Ranking
 Exchange BTC Balance
 Proof of Reserves
 Decentralized Exchanges
 Funding Rate
 Funding Heatmap
 Liquidation Data
 Max Pain
 Long/Short Ratio
 Whale L/S Ratio
 Binance/Okex/Huobi L/S
 Bitfinex Margin L/S
 ETF Tracker
 Solana ETF
 XRP ETF
 Hong Kong ETF
 Bitcoin Treasuries
 Crypto Reversal
 Ethereum Reserves
 HyperLiquid Wallet Analysis
 Hyperliquid Whale Watch
 Large Transactions
 On-chain Movement
 Bitcoin ROI
 Stablecoin Market Cap
 Options Analysis
 News
News Articles
 Economic Calendar
 Features
 Wallet
 Contract Calculator


 Security
 Collections
 Watchlist
 Following
 BTC
BTC 比特币宏观冲击下的价格分析
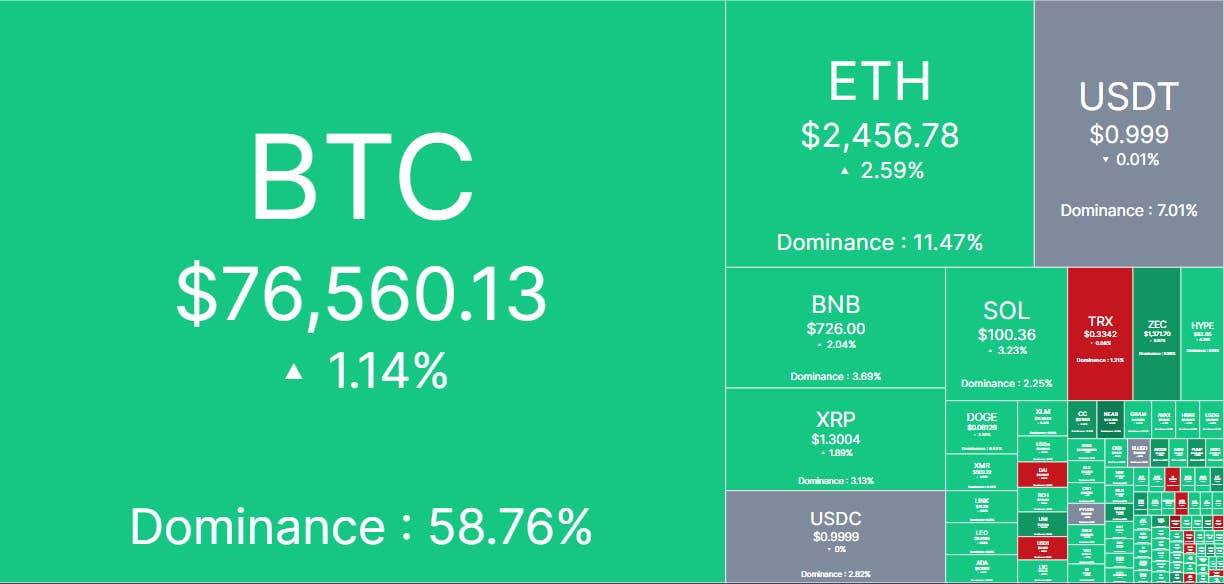
比特币在经历新一轮宏观冲击后,未破坏其突破后的整体结构。周三,美联储将目标利率上调25个基点至4.00%,这一紧缩举措同时也推高了美元汇率和美国国债收益率。尽管这对风险资产而言是传统的挑战背景,但BTC仍维持在76,700美元附近交易,尽管买方尚未重新掌握明确的主导权。
日线图技术分析
在日线时间框架上,比特币在被80,500-82,300美元的主要阻力区拒绝后,仍处于修正阶段。价格从9月份的高点逐渐回落,但跌幅相对可控,BTC仍稳固地位于关键的72,000-74,000美元支撑区域之上。
这种韧性在美联储加息25个基点后尤为显著。该决定并未导致立即的结构崩溃,而是让BTC在其主要突破区域上方进行整合。然而,美联储的预测表明,政策制定者认为通胀依然高企,并指向限制性政策背景,这意味着宏观压力并未完全消失。
与此同时,日线的RSI(相对强弱指数)已从之前的超买读数大幅降温,目前处于中性50区域附近。这表明早期的看涨动能已被重置,而非被强烈的看跌动能所取代。
As long as the $72,000 -74,000 support area is held, the broader bullish structure remains intact. If it breaks through $80,000 again, the resistance area of $80,500 -82,300 will once again become the focus. Conversely, a break below US$72,000 may expose a moving average of around US$68,000 -70,000, followed by a support area of US$66,000 -67,000.
Four-hour chart technical analysis
Four-hour chart shows a clearer short-term downtrend. Since hitting $82,300, Bitcoin has been trading in a downward channel, with a lower high and a lower bottom defining the correction process.
Prices recently tested the lower boundary of the structure in the $74,000 -75,000 region, before recovering to around $76,700. The four-hour RSI also rebounded from near oversold territory and returned to near the neutral 50 level, indicating that immediate selling momentum has weakened.
However, BTC is still located below the upper boundary of the channel and currently stands at approximately US$78,000 -79,000. Breaking through this trend line would be the first meaningful sign that the short-term correction is over and could open another attempt at the $80,500 -82,300 resistance zone.
On the other hand, if you encounter another rejection and fall below the channel, attention will turn to the support area of US$72,000 -74,000. The 0.5 Fibonacci retracement level of $72,500 strengthens the importance of this area, while deeper levels are seen at $70,200,$68,600 and $66,900.
Market Sentiment Analysis
The Coinbase Premium Index measures the difference between the price of Bitcoin on Coinbase and other major exchanges and can provide insights into buying and selling pressures on U.S. participants.
The latest reading is about-0.08, putting the index firmly in the negative range. This suggests that Bitcoin is traded at a discount on Coinbase, meaning U.S. spot demand remains relatively weak and selling pressure on the platform continues to outweigh active buying.
More importantly, the index deteriorated again after briefly entering positive territory in early September. This means that Bitcoin's resilience around US$76,000 -77,000 is not currently supported by particularly strong Coinbase demand.
So while BTC responded to the Fed's interest rate hike without a major technical meltdown, a negative Coinbase premium suggests caution. If the index continues to return above zero, especially with a breakthrough from the four-hour channel of decline, it will better confirm that spot buyers are returning and the market may be preparing to try the US$80,000 -82,300 resistance zone again.