Exchange Ranking
 Top Exchanges
 24h Volume Ranking
 Popularity Ranking
 Exchange BTC Balance
 Proof of Reserves
 Decentralized Exchanges
 Funding Rate
 Funding Heatmap
 Liquidation Data
 Max Pain
 Long/Short Ratio
 Whale L/S Ratio
 Binance/Okex/Huobi L/S
 Bitfinex Margin L/S
 ETF Tracker
 Solana ETF
 XRP ETF
 Hong Kong ETF
 Bitcoin Treasuries
 Crypto Reversal
 Ethereum Reserves
 HyperLiquid Wallet Analysis
 Hyperliquid Whale Watch
 Large Transactions
 On-chain Movement
 Bitcoin ROI
 Stablecoin Market Cap
 Options Analysis
 News
News Articles
 Economic Calendar
 Features
 Wallet
 Contract Calculator


 Security
 Collections
 Watchlist
 Following
 LINK
LINK Chainlink price forecast: LINK breaks through the consolidation range, and market attention turns to
As LINK quietly breaks through the tight consolidation range that has suppressed prices for a long time, discussions about Chainlink's price trend are heating up again. There has been a subtle shift in the daily chart that often catches many traders off guard because the previous pattern seemed bland but suddenly became eye-catching. A K-line has completely changed the tone of the market. Now the question that everyone is concerned about is: Is this a real trend reversal or a fake breakthrough about to occur? The following is a detailed analysis.
Today's Chainlink price: Real-time LINK data and 24-hour ups and downs
As of this snapshot, the Chainlink trading price is approximately US$11.652, a slight increase of approximately 0.22% from the opening price of US$11.628. Futures volume on the exchange was US$465.54 million, while spot volume was US$110.62 million, indicating that derivatives activity is still the dominant force driving LINK's short-term price volatility. Open interest positions were US$663.763 million, a high figure indicating that a large amount of leveraged positions have been accumulated around current prices. Chainlink has a market value of US$8.7 billion, a circulating supply of 748.09 million LINK, and both a fixed total supply and a maximum supply of 1 billion tokens.
Chainlink News: LINK returns to highs not seen since January this year
Chainlink has just hit a milestone that has not been on the chart for months. 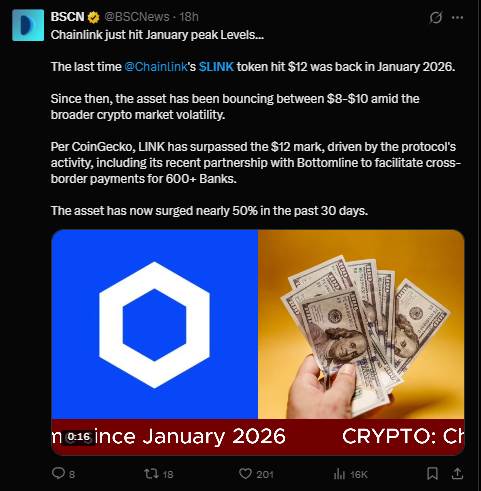 According to data cited by CoinGecko, LINK briefly hit the $12 mark after months of fluctuations in the $8 to $10 range and being affected by fluctuations in the overall cryptocurrency market, the first time since January 2026. Part of the new momentum has been attributed to continued agreement activity, including Chainlink's recent partnership with Bottomline to assist more than 600 banks in facilitating cross-border payments. Taken together, the token has increased by nearly 50% in the past 30 days. This momentum is the background of this breakthrough attempt.
LINK Technical Forecast: Price Forecasts and Breakout Levels
On the daily chart,$LINK hovered within a declining wedge pattern for most of late August to early September, with lower peaks exerting pressure on a relatively solid support platform below. This narrow range usually eventually breaks out in one direction, but this time it closed confirmation with a strong bullish daily line, pushing prices above the top of the pattern. This is often seen as a signal for buyers to quietly absorb selling pressure when the range appears flat.
Currently,$LINK is below a key resistance band, and the next daily closing price will determine whether this breakthrough has real follow-up momentum. If the daily line closes firmly above US$12.644, it will confirm a departure from the downward wedge pattern and effectively open up space for LINK to enter new areas. Since then,$15.001 has become the next resistance level to watch, about 28.7% higher than the current LINK price; the farther end of $20.186 has been marked as the main resistance area, nearly 73.3% higher than today's Chainlink trading price.
Downstream scenarios are equally important. If LINK turns to close below $10.050 (about 13.7% below the current price), it means that the breakthrough failed and the downward wedge pattern is re-established as resistance rather than a springboard. In this case, the next meaningful support to watch out for is at $8.920, which is about 23.4% below the current level; if selling pressure extends beyond the first support, near $8.455 further down the chart constitutes a deeper support area.
For now, a bullish daily chart and a clear departure from the downward wedge dominate the breakout scenario, but confirmation still needs to be confirmed until the daily close firmly above $12.644, rather than just briefly piercing the level.
LINK Support and Resistance Levels
Type Price Changes Relative to Current Price (CMP) Resistance Level 3 (Major)$20.186+73.3% Resistance Level 2 $15.001 +28.7% Breakout Trigger Level $12.644+8.5% Current Price (CMP)$11.652-Support Level 1$10.975- 5.8% fell below trigger level $10.050-13.7% support level 2$8.920-23.4% support level 3$8.455-27.4% bearish, benchmark and bearish scenarios
Bullish scenarios: LINK remained above the declining wedge breakthrough zone, pushing the daily close above US$12.644, and taking advantage of the recent 30-month 50% gain and news of the Bottomline partnership to move towards the US$15.001 or even US$20.186 region.
Benchmark scenario: LINK will retest the US$11 to US$12.644 range in a few trading days, allowing the breakthrough of the K-line to be digested before committing fully in either direction, which is a normal cooling-off period after such a fierce 30-day market.
Bear scenario: If the seller successfully pulls LINK back below US$10.050, it will completely reverse the recent breakthrough structure. Given the large number of open interest in the current market, such a trend could trigger a rapid decline towards the $8.920 support area, leading to the liquidation of leveraged bulls.
Risks to Watch
$LINK Open interest of more than US$600 million means leverage played an important role in this trend, but this double-edged sword may also have the opposite effect. A rapid reversal of the shadow could quickly unwind the large number of long positions recently established, so it is crucial to treat $12.644 as a confirmation rather than a guarantee. Broader market sentiment, additional Chainlink partnership news, and overall cryptocurrency volatility are all likely to change this pattern faster than the chart itself, so these levels are best used as a framework for tracking trends rather than a fixed roadmap.
Key Terms
Falling wedge: A consolidation structure in which prices compress between converging trendlines and eventually break out in one direction.
Breakout confirmation: Closing price outside key resistance or support levels, used to verify chart patterns rather than intraday short-term crossing behavior.
Open interest: The total number of derivative contracts that remain open, used as an indicator of active leverage positions.
Support shelf: Price area where buying interest repeatedly intervenes, acting as a bottom during the consolidation phase.
Disclaimer
This article is for reference only and does not constitute financial, investment or trading advice. The cryptocurrency market is extremely volatile, and price forecasts are based on technical analysis and may change rapidly with new market data. Before making an investment decision, be sure to conduct independent research and consult a qualified financial adviser.