Exchange Ranking
 Top Exchanges
 24h Volume Ranking
 Popularity Ranking
 Exchange BTC Balance
 Proof of Reserves
 Decentralized Exchanges
 Funding Rate
 Funding Heatmap
 Liquidation Data
 Max Pain
 Long/Short Ratio
 Whale L/S Ratio
 Binance/Okex/Huobi L/S
 Bitfinex Margin L/S
 ETF Tracker
 Solana ETF
 XRP ETF
 Hong Kong ETF
 Bitcoin Treasuries
 Crypto Reversal
 Ethereum Reserves
 HyperLiquid Wallet Analysis
 Hyperliquid Whale Watch
 Large Transactions
 On-chain Movement
 Bitcoin ROI
 Stablecoin Market Cap
 Options Analysis
 News
News Articles
 Economic Calendar
 Features
 Wallet
 Contract Calculator


 Security
 Collections
 Watchlist
 Following
 LINK
LINK Chainlink price forecast: The dual drive of trend-line breakthroughs and the influx of institutional funds
As LINK finally achieves the goal it has been trying to achieve for several days-to get rid of the trend-line that suppresses every rebound, the search for Chainlink (LINK) price forecast is picking up. The chart takes on a pattern that traders can recognize at a glance: a token moves slowly downward for several weeks under pressure, and then suddenly appears a K line that is completely different from the previous ones. Coupled with the recent updates on quietly accumulating institutional funds through spot ETF products, what's happening here is far more than what appears to be on the face of the market. The following is the complete market picture.
Disclaimer : This article is for information reference only and reflects independent chart analysis views. Neither the author nor CoinGabbar held LINK positions at the time of writing.
Today's Chainlink price: Real-time data and 24-hour changes
As of writing, LINK trading price was $11.511, down approximately 0.48% on the day, down approximately $0.056 from the previous day. This small correction appears insignificant in the face of the large-scale trend that the chart has just completed.
Futures volume in the past 24 hours was US$568.02 million, while spot volume was US$133.13 million. This gap suggests that leveraged traders have taken on the main push in this round. However, the scale of the K-line break itself suggests that the market has real confidence, rather than just being driven by weak leverage noise.
The current market value of LINK is approximately US$8.61 billion, and Open interest is US$608.05 million. This means there is still a large amount of leverage open on the floor, which may strengthen the ultimate direction of this breakthrough. The circulation supply is 748.09 million LINKS, and the total supply and maximum supply are 1 billion, so about three-quarters of the potential supply has entered the circulation field.
Data source: CoinGlass, LINK Market Data, visit date: September 12, 2026.
Chainlink News: ETF inflows continue to rise
The latest Chainlink news adds substantial weight to this breakthrough story. 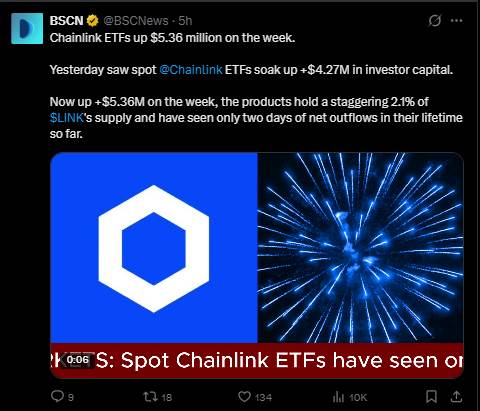 According to BSCN's post on the X platform, the cumulative inflow of the spot Chainlink ETF this week was US$5.36 million, of which an increase of US$4.27 million was made the previous day alone.
This speed is critical and it drives these fund products to now hold 2.1% of LINK's total supply. This is a meaningful share for a relatively short set of funds. More indicative is the record behind it: So far, these ETFs have seen net outflows for only two days over their entire life cycle. This consistency suggests stable accumulation rather than fast-moving short-term capital flows.
For traders currently making Chainlink price forecasts, this combination-technical breakthroughs combined with accelerated institutional demand-is the kind of setting that will easily attract more attention once it appears on the chart.
Data source: BSCN via X, September 12, 2026, spot Chainlink ETF inflow data.
Quick overview: LINK Overview of price movements
- Current price (CMP): $11.512 (Bybit 1 hour chart)
- Breakthrough signal: The price just broke through the downtrend line, accompanied by a bullish volume K-line that is significantly larger than the previous selling K-line.
- Hour trigger conditions: If it is stable above $12.209 again, the breakthrough will be confirmed and the path to $13.681 and $15 will be opened.
- Failure point: If the close is below $10.898, there is a risk of sliding towards $10.384.
- Momentum readings: Momentum readings near the chart oscillator are close to 46.40, with bullish and bearish signals mixed and the market is digesting the breakout.
- Data timestamp: September 12, 2026, a 1-hour chart of Bybit's perpetual contract.
Risk warning: Breakthroughs under high volume tend to last longer than breakthroughs under low volume. But backtesting old trend lines remains a normal and healthy part of such markets.
LINK Technical Analysis: The trend line supported by real volume breaks through
Observe the 1-hour LINK/USDT perpetual contract chart on Bybit. The protagonist of the story is a token that has been falling for several weeks under a clear downtrend line, but then breaks free from its shackles decisively. 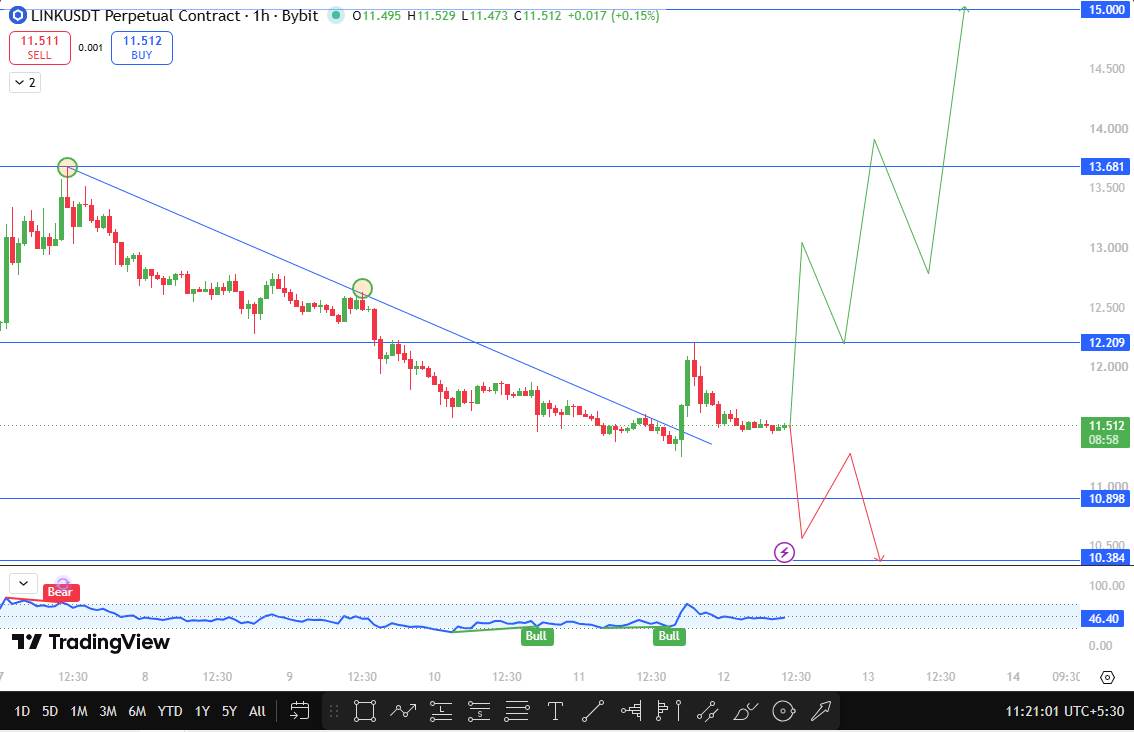 Prices slowly decline for more than a week, with each small rebound being sold back to the same decline line, a pattern that often gives sellers a false sense of control.
This sense of control was recently broken when LINK printed a bullish K-line with huge volume, whose volume far exceeded anything during the decline, clearly indicating that buyers were entering on a large scale rather than just tentative positions. The trend line that once suppressed every attempt is now below the price, and the chart sees it as the first real test of whether a breakthrough is effective.
If LINK can charge above $12.209 again, this will confirm that the buyer has real control over the area. The next level of resistance to watch out for is $13.681, which coincides with the old band highs on this same chart. Once a breakthrough is confirmed, the psychological barrier of $15 will become the next major goal set by this Chainlink technical analysis, although getting there may not be a straight-line movement overnight, but requires multiple clean advances.
On the other hand, if the breakthrough is a trap and LINK closes below $10.898, it means that the seller has regained control and opened the door to $10.384, which would be a clear failure of the current structure.
Data source: TradingView, LINK/USDT Perpetual Contract, Bybit, 1-hour chart, access date: September 12, 2026.
Chainlink support and resistance levels to watch for
Chainlink (LINK) key price vs. Current price $11.512
Tier Type Price Distance from Current Price Range Main Resistance Level $15.000+30.3% Resistance Level 2$13.681+18.8% Resistance Level 1$12.209+6.1% Current Price $11.512-Support Level 1$10.898-5.3% Main Support Level $10.384-9.8% LINK Bulls, Benchmark and Bear Scenarios
The bullish path in this Chainlink price outlook depends on whether the high-volume K-line marks a real shift rather than a one-time pulse. If the closing price is above $12.209, it will be the clearest confirmation that the breakthrough is sustainable; if maintained,$13.681 will become the next test point, and $15 will be a more longer-term target. Given the magnitude of fluctuations that have already occurred on the chart, this path may unfold quickly if buyers continue to enter.
The benchmark scenario is a result of more patience, which is not surprising considering the intensity of the initial exercise. LINK may conduct a period of consolidation between $10.898 and $12.209 so that the market can absorb breakout and new ETF inflow news before committing the next wave of market movements.
A bearish scenario occurs when the breakthrough fails and LINK returns to close below $10.898. This will open a downstream channel to $10.384. While the cumulative ETF story remains a supportive backdrop, a clear break here will still be a signal for technical traders to step back and reassess.
Risk of this Chainlink price forecast
Even high-volume breakthroughs sometimes fail in the first backtest. Sharp fluctuations in bitcoin prices or shifts in broader risk appetite can easily override current settings, no matter how clean the chart looks. Leveraged positions remain a factor, as rapid two-way movements in prices can be amplified by liquidation as prices approach these resistance or support areas. The continued speed of ETF inflows is another variable to watch for, as a slowdown there could weaken current momentum.
Explanation of key terms
Trendline
A line connecting a series of price highs or lows, indicating the direction of price respect, usually serving as support or resistance before a breakthrough.
Open Interest
The total number of derivative contracts (such as futures) that remain unsettled is often used to measure the size of leveraged funds active in the market.
Breakout Candle
A single price K-line with a closing price decisively outside the key level, often accompanied by abnormally high trading volumes, signals a potential shift in market control.
Disclaimer
This article is for reference only and should not be regarded as financial advice. The cryptocurrency market is extremely volatile, and price forecasts are based on technical analysis and will change rapidly as new markets emerge. Before making any investment decisions, be sure to conduct independent research.