Exchange Ranking
 Top Exchanges
 24h Volume Ranking
 Popularity Ranking
 Exchange BTC Balance
 Proof of Reserves
 Decentralized Exchanges
 Funding Rate
 Funding Heatmap
 Liquidation Data
 Max Pain
 Long/Short Ratio
 Whale L/S Ratio
 Binance/Okex/Huobi L/S
 Bitfinex Margin L/S
 ETF Tracker
 Solana ETF
 XRP ETF
 Hong Kong ETF
 Bitcoin Treasuries
 Crypto Reversal
 Ethereum Reserves
 HyperLiquid Wallet Analysis
 Hyperliquid Whale Watch
 Large Transactions
 On-chain Movement
 Bitcoin ROI
 Stablecoin Market Cap
 Options Analysis
 News
 Articles
 Economic Calendar
 Features
 Wallet
 Contract Calculator


 Security
 Collections
 Watchlist
 Following
 SOL
TLDR
resistance range is between US$122.49 and US$123.53. Derivatives data showed mixed signals. Solana (SOL) was trading at $121.44, within a narrow 24-hour range of $120.00 to $122.29. All major moving averages are below current prices, ranging from $119.57 at the 7-day moving average to $86.16 at the 200-day moving average. Resistance is between $122.49 and $123.53, with support at $120.20 and $118.95 respectively. Open interest contracts fell 7.29% to approximately US$984 million, while 64.3% of top Binance traders still hold long positions. Analysts give a 55% probability of a rise to $128 - 130 and a 45% probability of falling to $116.31.
Solana Market Dynamics Analysis
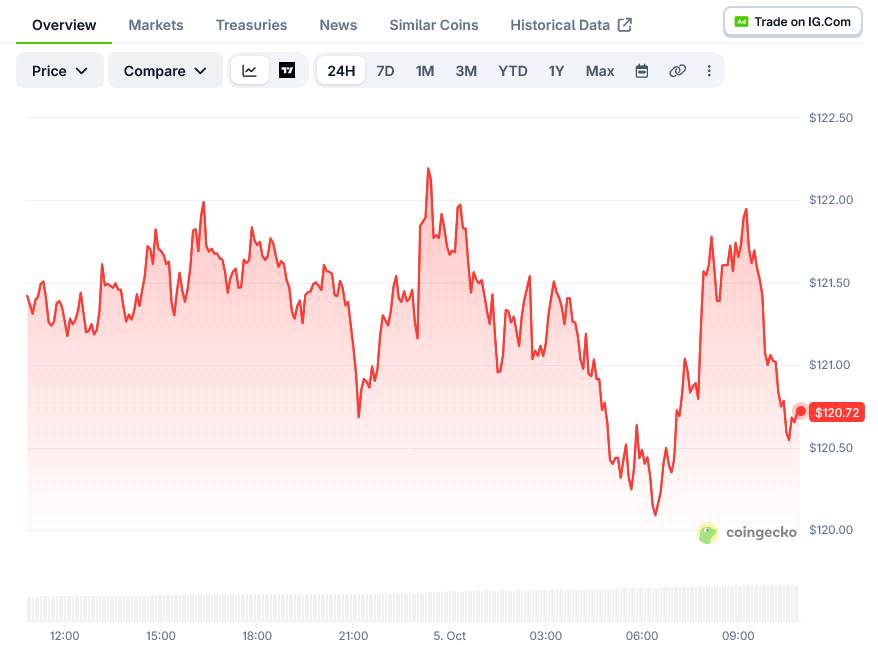
On October 5, the trading price of Solana (SOL) was US$121.44, with a intra-day change of 0.28%. Prices remain within a narrow 24-hour range between $120.00 and $122.29. All major moving averages for SOL are below current prices: the 7-day moving average is $119.57, the 20-day moving average is $116.31, the 50-day moving average is $105.66, and the 200-day moving average is $86.16. These moving averages all show upward trends, with the 200-day moving average approximately 41% lower than current prices.
Key technical indicators and resistance levels
Resistance areas
Traders pay close attention to the resistance area between $122.49 and $123.53. In recent trading days, SOL has encountered multiple selling pressure near the lower edge of this range. Momentum indicators show that the recent rebound has slowed. The MACD histogram read zero and the RSI (Relative Strength Index) was 65.58. The Stochastic %K value is 71.68, crossing the %D line at 57.35, indicating a slight increase in short-term momentum. In terms of Bollinger Bands, SOL's %B reading is 0.70, with the upper rail at $128.90. The daily pivot point is $121.24, slightly below current prices. Immediate support is at $120.20, and the next level of support is at $118.95.
Derivatives data signals are mixed
In the Binance futures market, 64.3% of top traders hold long positions and 35.7% hold short positions, with a long-short ratio of 1.80; retail traders also mostly hold long positions, with a proportion of 62.1%. Open interest fell 7.29% to approximately $984 million in 24 hours. Open interest falls and prices are flat, which usually means that traders are closing positions rather than opening new positions. The capital rate is 0.0100%, which is at a neutral level. The active buy/sell ratio was 1.0999, with approximately US$350,000 of active buy orders versus US$318,000 of active sell orders.
Future Outlook
Blockchain.news analyst Rebecca Moen proposed two possible paths for the next 14 days. She puts the probability of a bullish scenario at 55%, and a bearish scenario at 45%.
Bullish scenario: If SOL breaks through US$122.49 and stands above US$123.53 amid strong trading volume, the price could point to the US$128 to US$130 range. If $122.49 is not recovered within five trading days, the bullish view will expire.
BELOW Scenario: If SOL breaks below the support level of $120.20, it may fall back to $116.31 where the 20-day moving average is located. A deeper decline could hit the US$113 to US$114 range (where the 26th EMA is located), with this downward path confirmed if the daily close below US$118.95.
The analysis also pointed out that the price trend of Bitcoin in the next two weeks may determine the direction of SOL. Layer-1 tokens like Solana tend to follow broader cryptocurrency market sentiment. As of 10:54 UTC, real-time data showed the SOL price at US$120.69, a decrease of 0.02% in the minute chart.