Exchange Ranking
 Top Exchanges
 24h Volume Ranking
 Popularity Ranking
 Exchange BTC Balance
 Proof of Reserves
 Decentralized Exchanges
 Funding Rate
 Funding Heatmap
 Liquidation Data
 Max Pain
 Long/Short Ratio
 Whale L/S Ratio
 Binance/Okex/Huobi L/S
 Bitfinex Margin L/S
 ETF Tracker
 Solana ETF
 XRP ETF
 Hong Kong ETF
 Bitcoin Treasuries
 Crypto Reversal
 Ethereum Reserves
 HyperLiquid Wallet Analysis
 Hyperliquid Whale Watch
 Large Transactions
 On-chain Movement
 Bitcoin ROI
 Stablecoin Market Cap
 Options Analysis
 News
News Articles
 Economic Calendar
 Features
 Wallet
 Contract Calculator


 Security
 Collections
 Watchlist
 Following
 BTC
BTC  ETH
ETH IBIT and ETHA: The rates are the same, but the fund performance is very different-what does the rates reveal and what does it conceal?
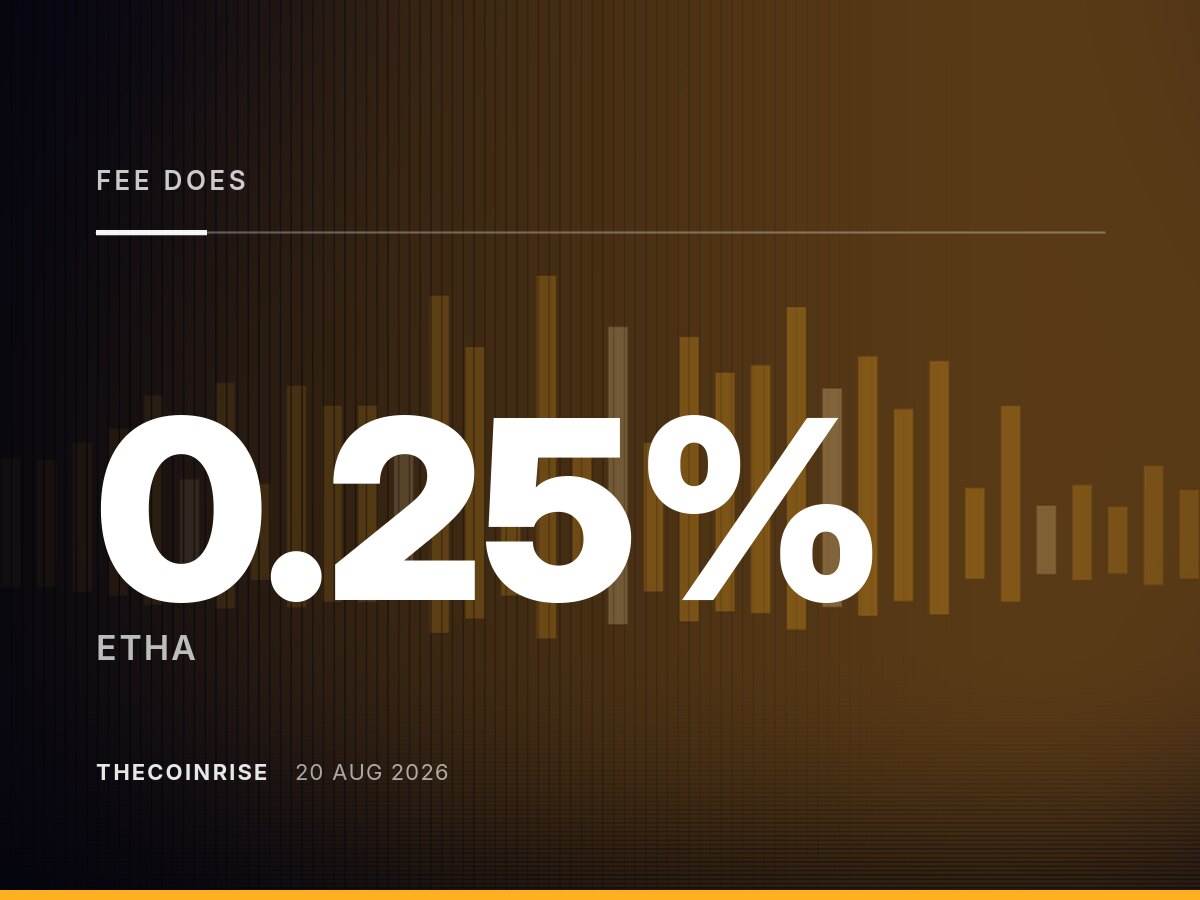
According to the comparison on April 24, 2026 and the fund form of June 2026, both IBIT and ETHA charge an annual management fee rate of 0.25%. The rates are the same, but otherwise, the two funds have little in common: in the past year ended April 22, 2026, the two have moved in opposite directions; asset sizes differ by tens of billions of dollars depending on the source and date of the inquiry; and in this set of evidence, neither of the two funds 'public reports mentions the trading spread actually paid by buyers and sellers.
The rates are the same, but that's all the similarities.
Actual costs behind the same rate at 0.25%
Using IBIT's 0.25% management fee rate, assuming that $100,000 is invested and the Bitcoin price remains constant (in order to isolate the rate impact from price fluctuations), compound interest calculation results show that after five years, the value of the position is $98,756, and $1,244 has been paid; after ten years, the value of the position is $97,528, and $2,472 has been paid. The summary paragraph from the same source gives different ten-year cost figures-"approximately $2,528"-which is an inconsistency within the source that is only noted and not resolved here; the figure is $2,472 calculated using the table below. This calculation is for IBIT, using IBIT's own rates and the methods described above. No source in the available evidence has performed the same ten-year calculation for ETHA. Since ETHA's management fee rate is also 0.25%, ETHA's machinery fee results are the same for positions of the same size-this is a rate-based estimate here and is not a figure reported by ETHA or any of its sources.
In other words, if you hold any fund for ten years, the fee drag is about 2.5% of the original position. This is a fixed machinery cost that is much smaller than the price fluctuations actually generated by the two funds, and the two are independent of each other.
Actual difference between the two funds
A snapshot as of April 24, 2026 shows that in the past 12 months ended April 22, 2026, IBIT fell 14.1%, while ETHA rose 40.7%-a difference attributed to the very different trends of Bitcoin and Ethereum over this period, rather than differences in fund structure. In the same article, IBIT's assets under management were US$63.7 billion, and ETHA's were US$7.6 billion, a ratio of approximately 8 times. Another source gave lower numbers for IBIT: An article dated August 19, 2026 stated that IBIT managed assets "in excess of US$23 billion." These two numbers come from different dates (April and August 2026) and are not reconciled here; readers who need to understand the current size of IBIT should consult the fund's own fact sheet rather than any snapshot.
Risk profiles are also different. The comparison table shows that the largest one-year pullback for ETHA is-64.02% and IBIT is-49.36%. It is worth noting that the withdrawal of ETHA is separately mentioned in the body of the article as-61.66%-this is also an inconsistency within the source, reminding us that even the figures for the same fund in the same media may contradict each other in the same article. The table also shows that the $1000 investment in IBIT a year ago will grow to $859 as of the article date; the corresponding dollar growth figure for ETHA is not given in the table.
As of the article ending April 24, 2026, ETHA's fund was established for 1.8 years, reflecting its launch time in mid-2024, and its duration is shorter than the older Bitcoin fund-the article itself regards this as a data limitation rather than a quality judgment.
Another source complicates the scale image. The June 2026 fund form listed ETHA's assets under management at approximately US$16.1 billion, with a one-year return of +13.9%-both figures that contradict the above US$7.6 billion and +40.7%. The source itself marked its managed assets column as "estimated" and warned that the 2026 managed asset figures are "highly volatile based on institutional rotation between spot and pledged products." The two sources use different snapshot dates (April and June 2026) and different methods, and neither should be considered conclusive without reviewing the fund's own current disclosures.
The same table also provides useful comparison points for other Ethereum funds in June 2026: Fidelity's FETH management fee rate is 0.25%, with assets under management of US$1.9 billion, and a one-year return of 13.5%; Gray's traditional ETHE rate is 2.50%, with assets under management of US$3.2 billion, and a return of 12.1%; Gray's low-cost Ethereum mini trust rate is 0.15%. Pledge yields for Ethereum ETFs (another category) that support pledges typically range from 3.8% to 5.5%-ETHA does not participate in such gains because it only holds spot Ethereum and cash.
Alternative to Self-Custody
These two fund packages exist because most investors are reluctant to manage cryptocurrency wallets. Holding an ETF means no need to manage private keys, no exchange risks, and ETF shares can be included in tax-preferential accounts such as IRAs, which is usually not possible to directly hold crypto assets. The price is abandoning 24/7 transactions, being unable to transfer underlying assets, and paying an annual fee of 0.25% indefinitely-a fee that self-managed wallets don't charge.
For Bitcoin, the one-time cost of a hardware wallet ranges from $79 to $219, while ETFs charge a continuous annual fee. Similar one-time cost figures set by the Ethereum hardware wallet are not given in the available evidence, but the mechanism is the same-a comparison of one-time hardware costs and ongoing management fee rates.
What is not disclosed in this article
The bid-ask spread for IBIT or ETHA-the actual cost of the bid-buy share in the market, which is different from the annual management fee rate-is not reported in the available evidence. This is a real gap in the question originally intended to answer in this article, and no estimates have been used to fill it here.
Fund-specific numerical tracking error-how closely fund share prices track their underlying reference index on a daily basis-is available only in aggregated range form: According to another source, the annualized tracking error for 11 U.S. spot bitcoin ETFs ranged from 0.03% to 0.42%. This figure does not stand alone for IBIT and there is no equivalent figure for ETHA or any other physical Ethereum ETF in the evidence. The fund table does describe the tracking error of ETHA relative to the CME CF Ethereum USD reference rate as "minimal," but this is a qualitative description with an "Editor's Choice" badge-reported here only as a description of the source itself, not as an independently verified measurement.
ETHA's assets under management and one-year return figures are contradictory between the two (the former is US$7.6 billion,+40.7%, snapshot date April 22-24, 2026; the latter is estimated US$16.1 billion,+13.9%, date June 2026). The two use different dates, and based on the latter's disclosure, different estimation methods are used. No amendment is made to either party here, but its source and date are reported at the same time so that readers can judge which is closer to current reality by consulting the fund's own fact sheet. There is a similar contradiction in IBIT's assets under management: the former is US$63.7 billion (April 2026), and the latter is "more than US$23 billion"(August 2026)-the same dates are different, and both are reported without resolution.
The latter presents itself in a promotional framework ("Editor's Choice" badges and list-style marketing copy), which is treated here only as clues and self-disclosed sources of estimates, and never as an independent confirmation of facts reported from other sources.
Finally, the above ten-year fee calculation assumes that the currency price remains unchanged, which is explicitly proposed to isolate the impact of fees, and the calculation is for IBIT rather than ETHA-the figure for ETHA is an estimate based on the same 0.25% rate for both, and is not the reported calculation result. The real returns of the two funds (as shown in the one-year data) are far from equal-so the expense drag is a small, predictable part of larger and unpredictable price fluctuations, rather than the decisive factor in investors 'actual returns.
Source
Each of the above facts is attributed to one of these reports. When they have differences, the article has clearly pointed out.