Exchange Ranking
 Top Exchanges
 24h Volume Ranking
 Popularity Ranking
 Exchange BTC Balance
 Proof of Reserves
 Decentralized Exchanges
 Funding Rate
 Funding Heatmap
 Liquidation Data
 Max Pain
 Long/Short Ratio
 Whale L/S Ratio
 Binance/Okex/Huobi L/S
 Bitfinex Margin L/S
 ETF Tracker
 Solana ETF
 XRP ETF
 Hong Kong ETF
 Bitcoin Treasuries
 Crypto Reversal
 Ethereum Reserves
 HyperLiquid Wallet Analysis
 Hyperliquid Whale Watch
 Large Transactions
 On-chain Movement
 Bitcoin ROI
 Stablecoin Market Cap
 Options Analysis
 News
 Articles
 Economic Calendar
 Features
 Wallet
 Contract Calculator


 Security
 Collections
 Watchlist
 Following
 BTC
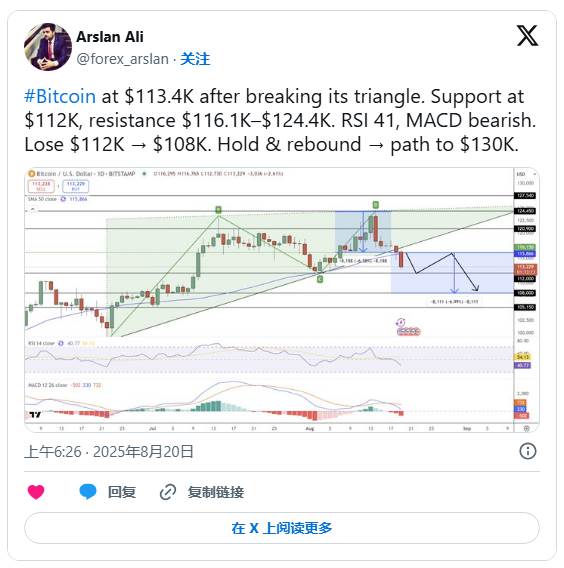
The price of Bitcoin has experienced recent fluctuations, drawing widespread attention from the market. Recent data shows that its price dropped to $113,400, a decrease of over 2.75% in just one day. This trend is not accidental; it stems from a key technical change in the market pattern. Over the past few weeks, Bitcoin has been fluctuating within an “uptrending triangle” pattern. Many investors consider $115,000 to be a strong support level. However, as the price finally broke below this level, market sentiment became tense, serving as a warning for those traders who rely on this support level.
This decline is not just a numerical adjustment; it seems to be a signal from the market: will the bull market be interrupted, or is this just a short-term correction? Let’s take a look at the potential risks and opportunities behind this situation.

This decline also pushed Bitcoin below the 50-day moving average ($115,870), making this level now a resistance level.
This correction came after a strong resistance at $124,450, when a bearish engulfing pattern ended a four-week uptrend. This reversal changed the short-term trend from a bullish direction to a corrective pullback. The key now is whether Bitcoin can stabilize at this level, or if there will be further declines.
The risk of a head and shoulders pattern increases.
On the daily chart, a head and shoulders pattern can be seen. The neckline support is at $112,000. If the price effectively breaks below this level, it may continue to fall towards $108,000, and there is even a possibility of reaching the extended target of $105,150. The current candlestick pattern also indicates caution; several strong bearish candles have appeared, resembling the early stages of a “three crows” pattern, suggesting that downward momentum may continue.
Technical indicators also support this view. The MACD has turned negative, and the RSI is around 41, not yet entering the oversold zone. This means there is still room for further decline, but a strong rebound is not guaranteed.
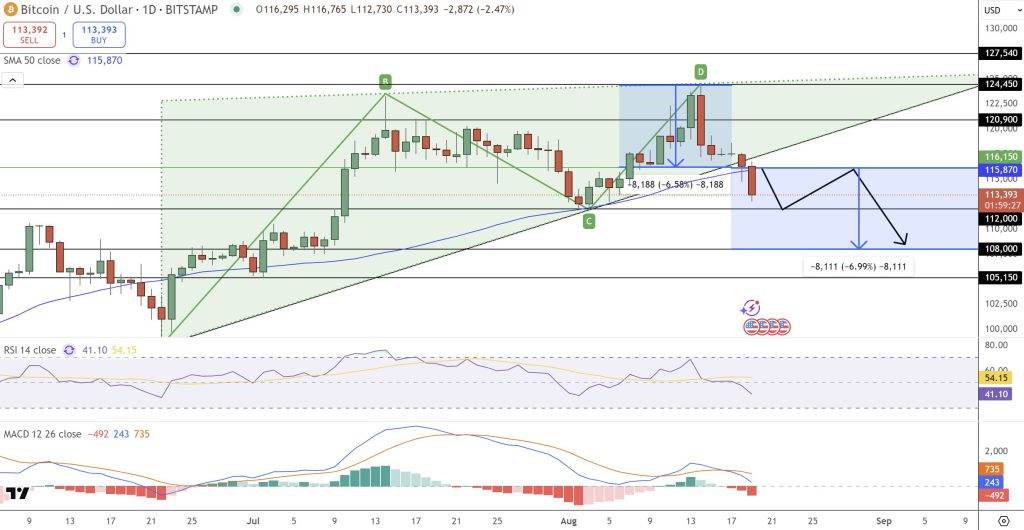
However, the major trend has not been disrupted. Looking more closely, since June, Bitcoin has maintained a higher low structure. Currently, multiple small candlesticks are forming in the $113K-$114K range, including doji and spindle-shaped candles. These appear to be signs of hesitation rather than panic-driven selling.
The path toward $130K still exists.
Although short-term risks are negative, medium-term trends remain optimistic. If bulls can stabilize above $116,150, BTC may rebound to $120,900. Once it breaks through $124,450, there may be opportunities to target levels as high as $127,540 or more.
For traders' reference:
● Bullish approach: Look for a bullish engulfing pattern above $116,150. If one appears, it would be a buying signal. The target range is $120,900–$124,450. The stop loss should be set below $112,000.
● Bearish approach: If the price drops below $112,000, it would be an opportunity for short selling. The next target is around $108,000, and the stop loss should be set above $116,000.
Although there is short-term pressure on the market, institutional funds and long-term investors are still supporting the price. Companies like Metaplanet and Strategy continue to buy when prices fall, indicating that market sentiment has not completely turned negative.
The coming weeks are crucial. If the price breaks below $112,000, BTC could quickly reach $100,000. However, if the price can break through key resistance levels, there will be a chance to return to the $130,000 range, especially if the macro environment stabilizes.
For long-term investors, the overall trend remains positive, with this adjustment more resembling a period of consolidation rather than the end of an uptrend.