Exchange Ranking
 Top Exchanges
 24h Volume Ranking
 Popularity Ranking
 Exchange BTC Balance
 Proof of Reserves
 Decentralized Exchanges
 Funding Rate
 Funding Heatmap
 Liquidation Data
 Max Pain
 Long/Short Ratio
 Whale L/S Ratio
 Binance/Okex/Huobi L/S
 Bitfinex Margin L/S
 ETF Tracker
 Solana ETF
 XRP ETF
 Hong Kong ETF
 Bitcoin Treasuries
 Crypto Reversal
 Ethereum Reserves
 HyperLiquid Wallet Analysis
 Hyperliquid Whale Watch
 Large Transactions
 On-chain Movement
 Bitcoin ROI
 Stablecoin Market Cap
 Options Analysis
 News
 Articles
 Economic Calendar
 Features
 Wallet
 Contract Calculator


 Security
 Collections
 Watchlist
 Following
 SOL
Recent technical indicators suggest that the price of Solana (SOL) is on an upward trend. Analysts believe that if market momentum continues, SOL could reach a new target price of $260, providing potential opportunities for investors to consider.

The technical chart for SOL shows a target price of $260.
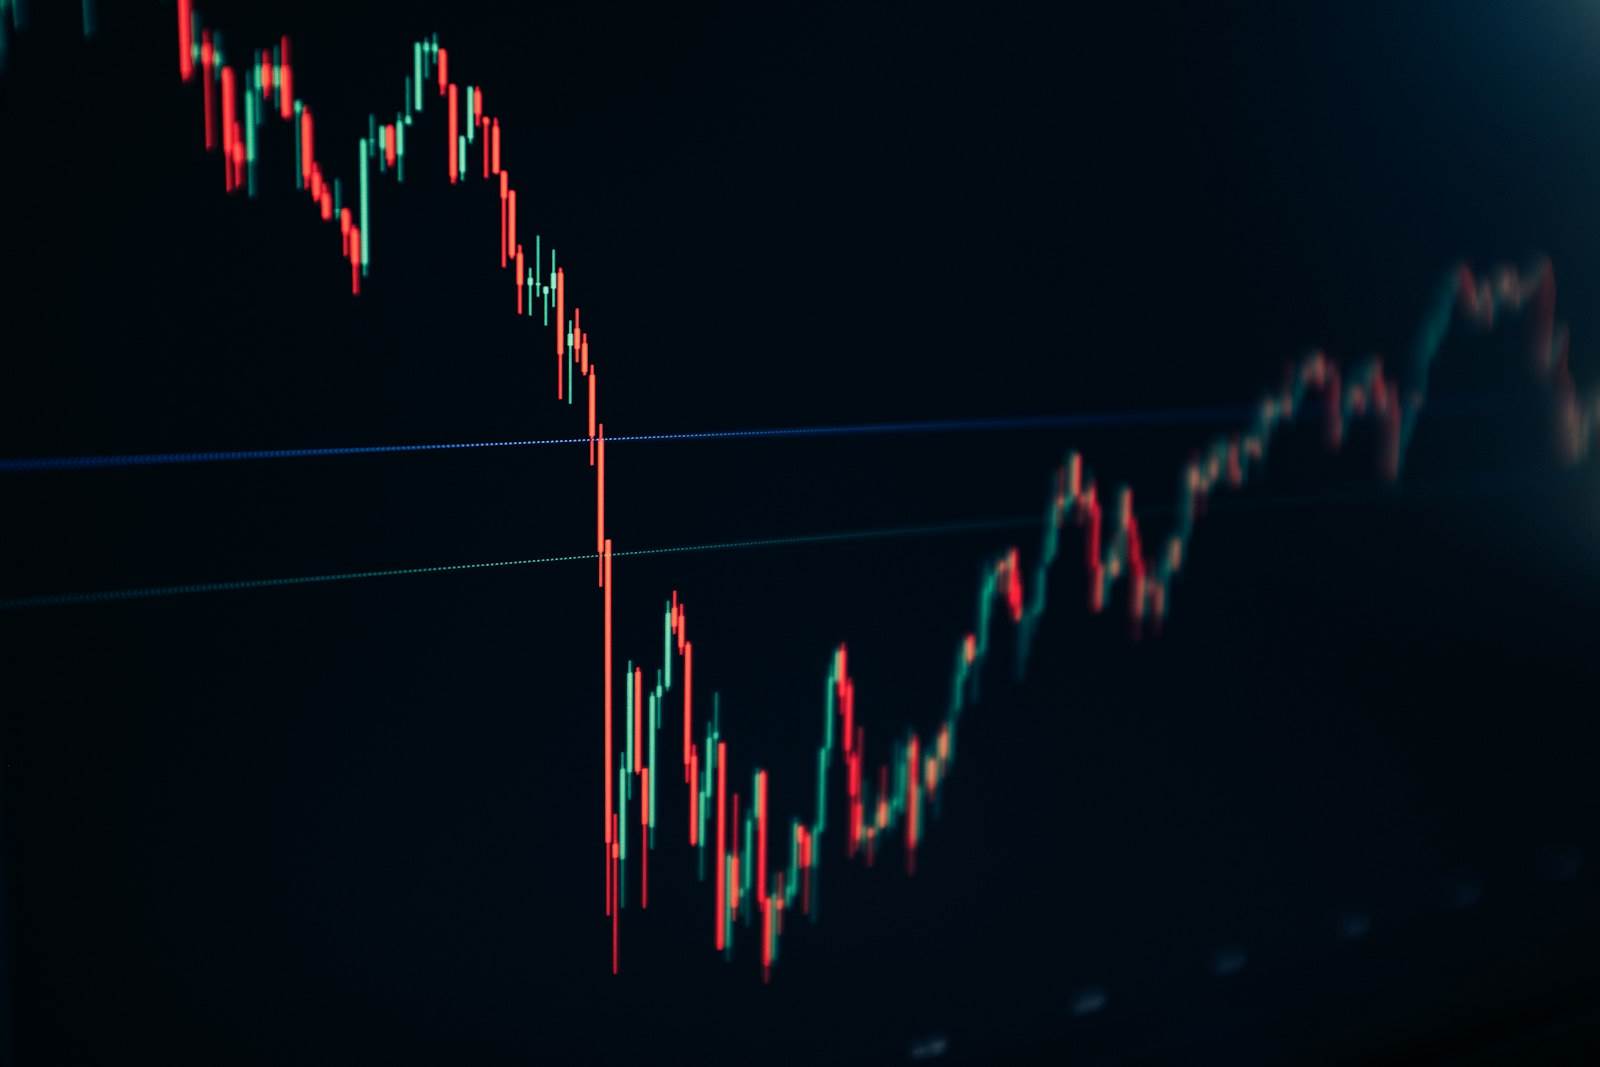
After soaring to a six-month high of $209 last week, SOL fell by 16% to a low of $175 on Tuesday. Since then, SOL’s price has recovered to $180, and various indicators indicate that its upward trend towards $260 remains intact.
The SOL chart indicates a target price of $260.
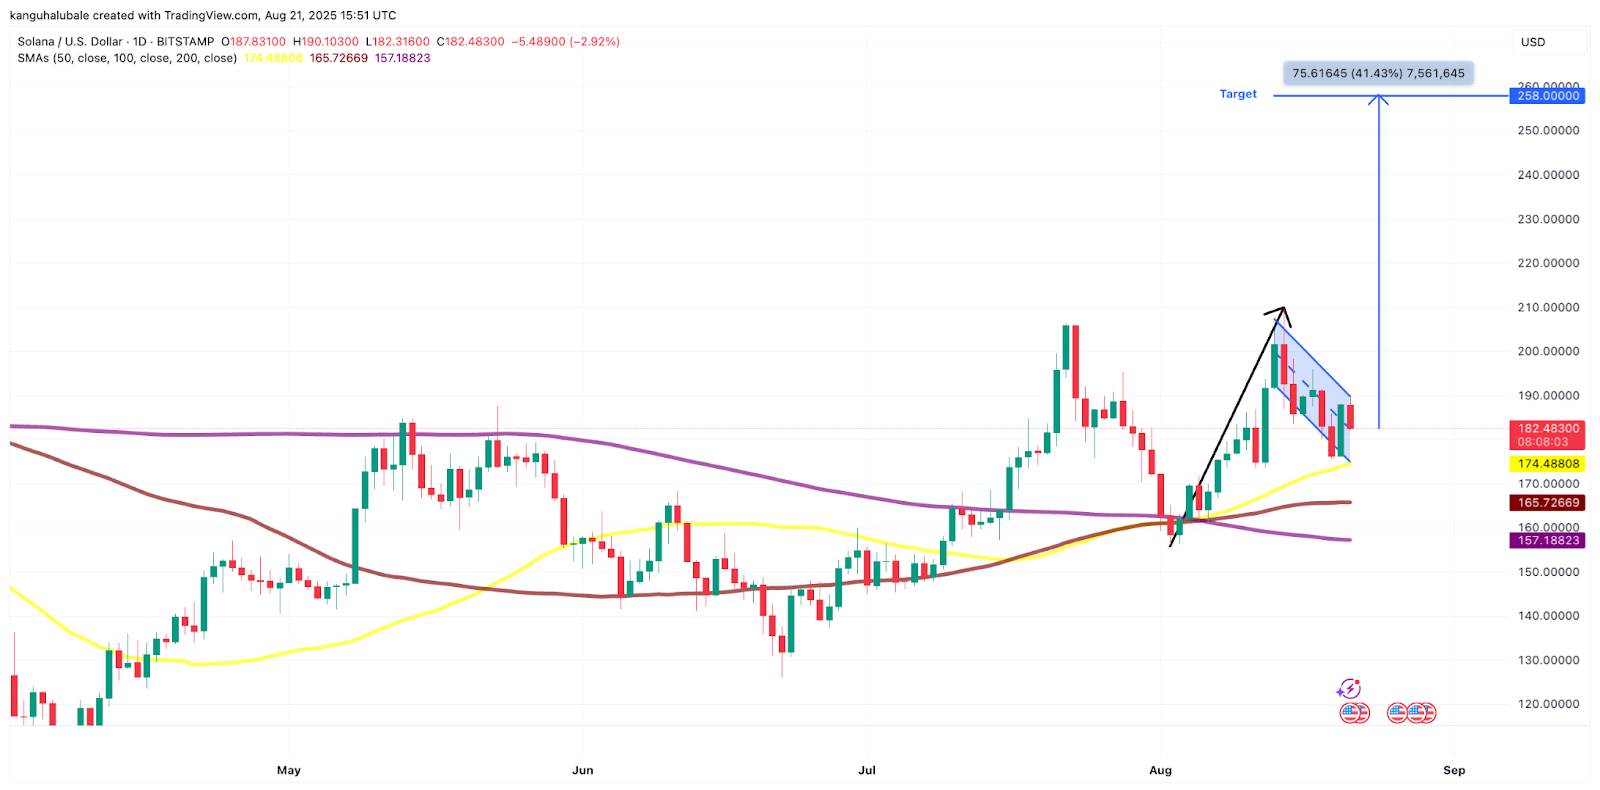
Data from Cointelegraph Markets Pro and TradingView shows that SOL is currently in an uptrending flag pattern, as shown in the chart below.
The uptrending flag is a bullish technical pattern where prices rise sharply, followed by a downward channel indicating a consolidation phase. This pattern typically ends with a breakout upwards, continuing the upward trend.
Currently, SOL’s price encounters resistance at $190 along the upper edge of the flag pattern. If daily closing prices can break through this level, SOL could target the flag’s goal of $258, representing a 41% increase from the current price.
On a longer time frame, since the end of 2025, SOL’s price has formed a V-shaped reversal pattern over weekly time frames, as shown in the chart below.
A V-shaped reversal is a bullish pattern where an asset experiences a rapid rebound after a significant decline, with prices rising to the top of the V shape (the neckline), completing the pattern.
SOL is currently moving along this trajectory. Bulls will need to reset the price at 200 dollars as a support level, in order to increase the likelihood of a price increase to 220 dollars. Further down the line, the 260 dollars neckline could become the next reasonable target, thereby completing the V-shaped reversal pattern. This would represent a 43% increase from the current price. The Relative Strength Index has risen from 34 to 54 over the same period, indicating that bullish momentum is steadily increasing.
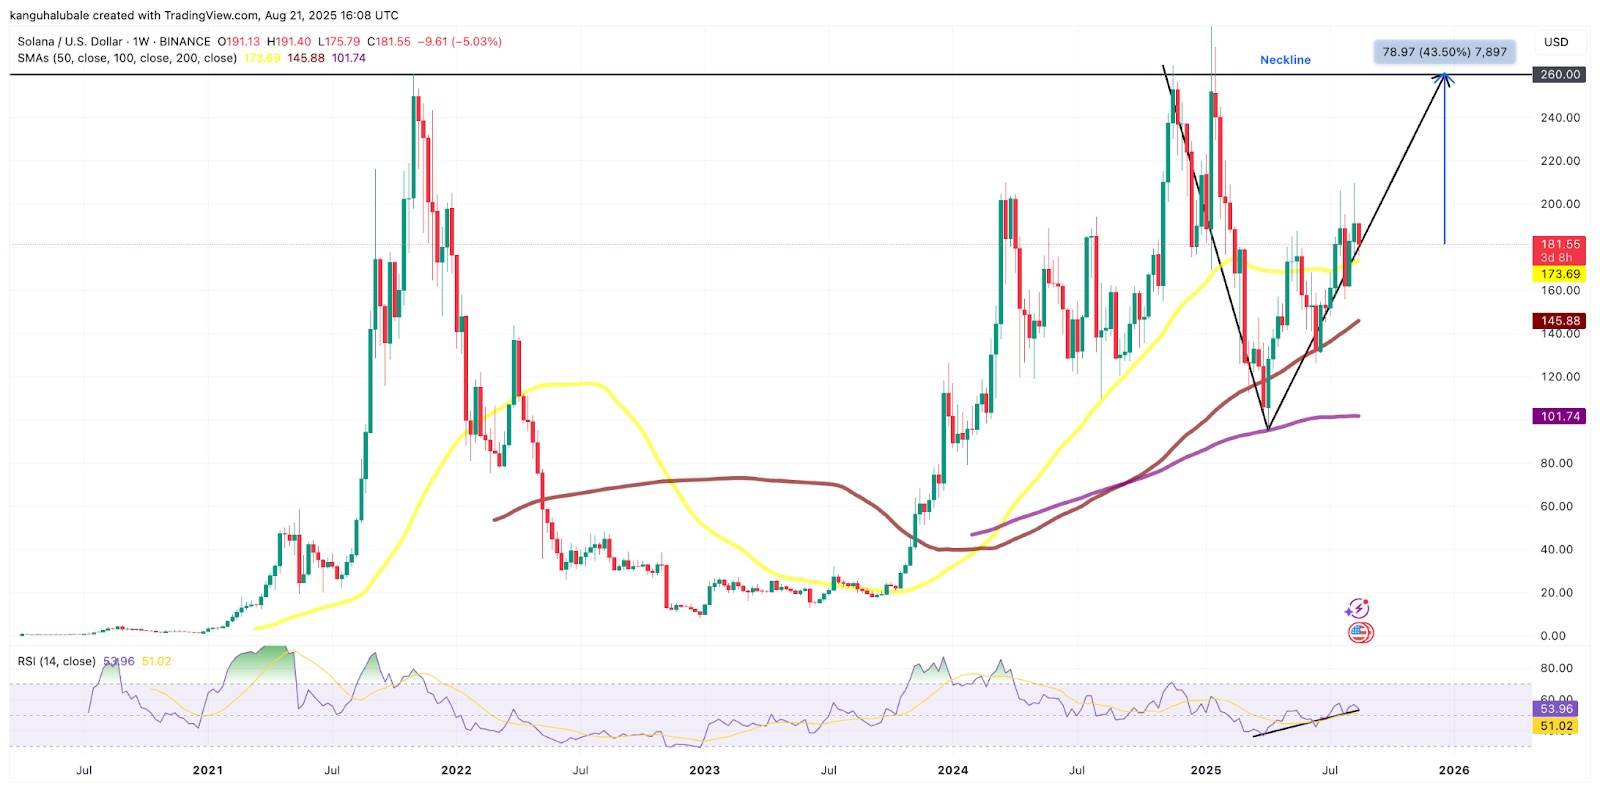
The RSI has also shown an increase from 34 to 54 on both weekly and daily charts, indicating strong support below the current level. On the shorter four-hour chart, SOL is above both the 100-day and 200-day SMA lines, further supporting the bullish position of SOL.
Analysts at Solana believe that SOL’s upside potential is still unlimited.
Many analysts believe that SOL still has room for further gains. Technical analyst Jonathan Carter pointed out that SOL’s ascending triangle pattern suggests potential for a significant breakthrough.
“Solana is once again testing the resistance levels above the daily chart, after a false breakout occurred earlier,” said the analyst in an article on the X platform on Tuesday. He added:
“A confirmed rebound from this area could validate the bullish structure, and push prices towards targets of 205 dollars, 225 dollars, and 268 dollars.”
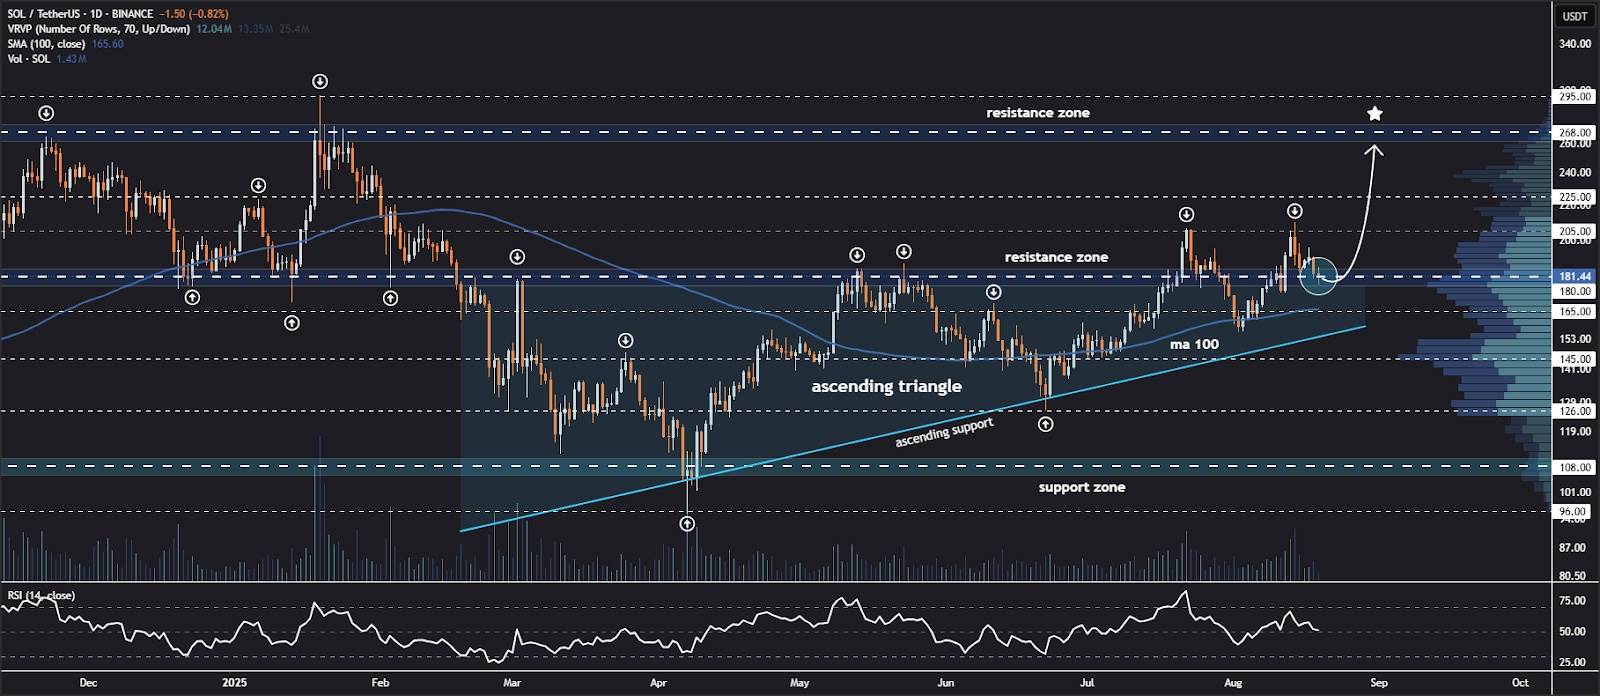
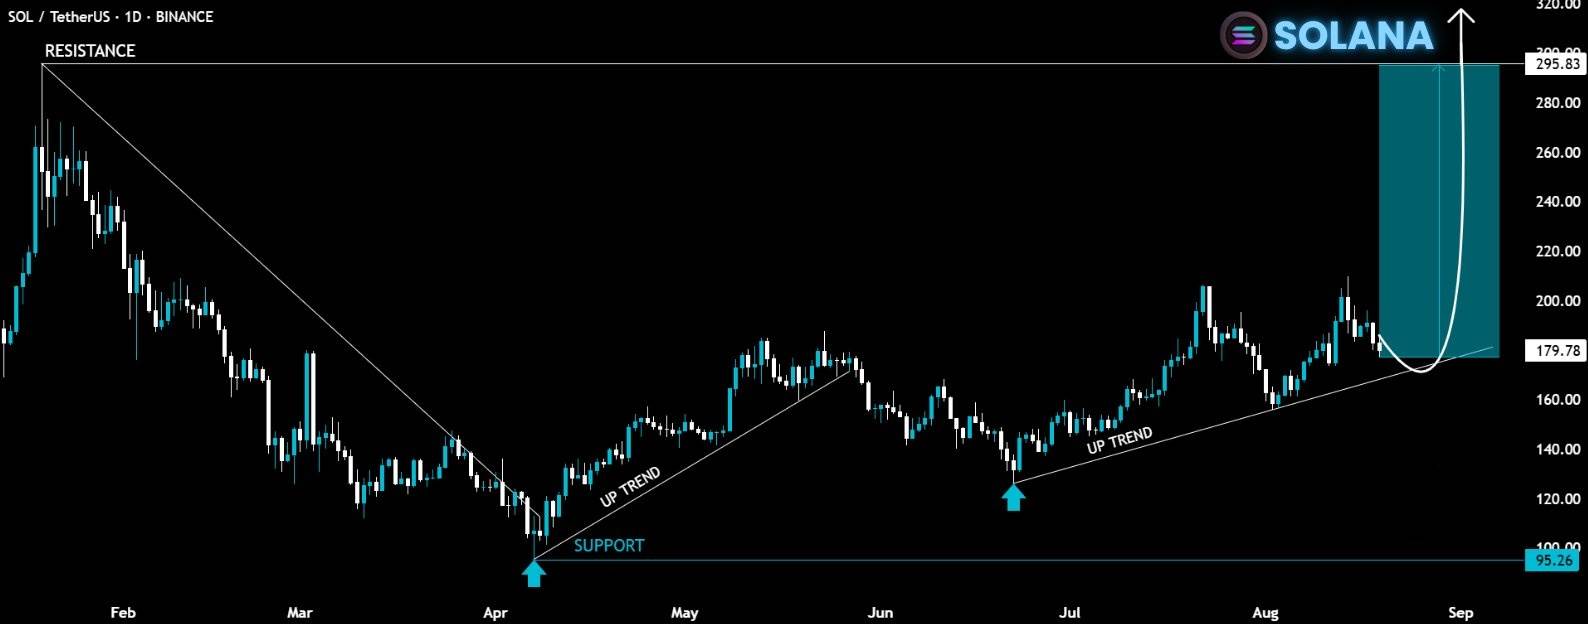
在6月22日达到124美元水平后,SOL价格形成了一系列更高的低点。根据分析师Crypto King的说法,从连接这些更高低点的上升趋势线的最新回暖提供了一个“完美反弹”,预计将推动SOL达到其295美元的历史高点。
从上升趋势支撑位完美反弹,确认低点走高。
不用想太多。目标价位在 295 美元。
多项链上指标和数据,如DeFi领域占比提升、手续费增长和高交易吞吐量,持续支撑网络需求,并增强投资者对SOL价格的长期信心。