Exchange Ranking
 Top Exchanges
 24h Volume Ranking
 Popularity Ranking
 Exchange BTC Balance
 Proof of Reserves
 Decentralized Exchanges
 Funding Rate
 Funding Heatmap
 Liquidation Data
 Max Pain
 Long/Short Ratio
 Whale L/S Ratio
 Binance/Okex/Huobi L/S
 Bitfinex Margin L/S
 ETF Tracker
 Solana ETF
 XRP ETF
 Hong Kong ETF
 Bitcoin Treasuries
 Crypto Reversal
 Ethereum Reserves
 HyperLiquid Wallet Analysis
 Hyperliquid Whale Watch
 Large Transactions
 On-chain Movement
 Bitcoin ROI
 Stablecoin Market Cap
 Options Analysis
 News
 Articles
 Economic Calendar
 Features
 Wallet
 Contract Calculator


 Security
 Collections
 Watchlist
 Following
 BTC
Last Friday, Bitcoin experienced another wave of severe selling pressure. The price dropped close to short-term lows, causing many investors to become anxious and tightly hold onto their wallets. Some people began to wonder whether this could be a sign of the end of the bull market. However, others believed that this might be the last opportunity to accumulate assets at low prices, in anticipation of another rebound. Regardless, these fluctuations remind us that the world of Bitcoin is always full of high risks and high opportunities—the panic and volatility on the short term may actually hide a potential “good opportunity to buy at low prices” in the future.
Bitcoin has plummeted again.
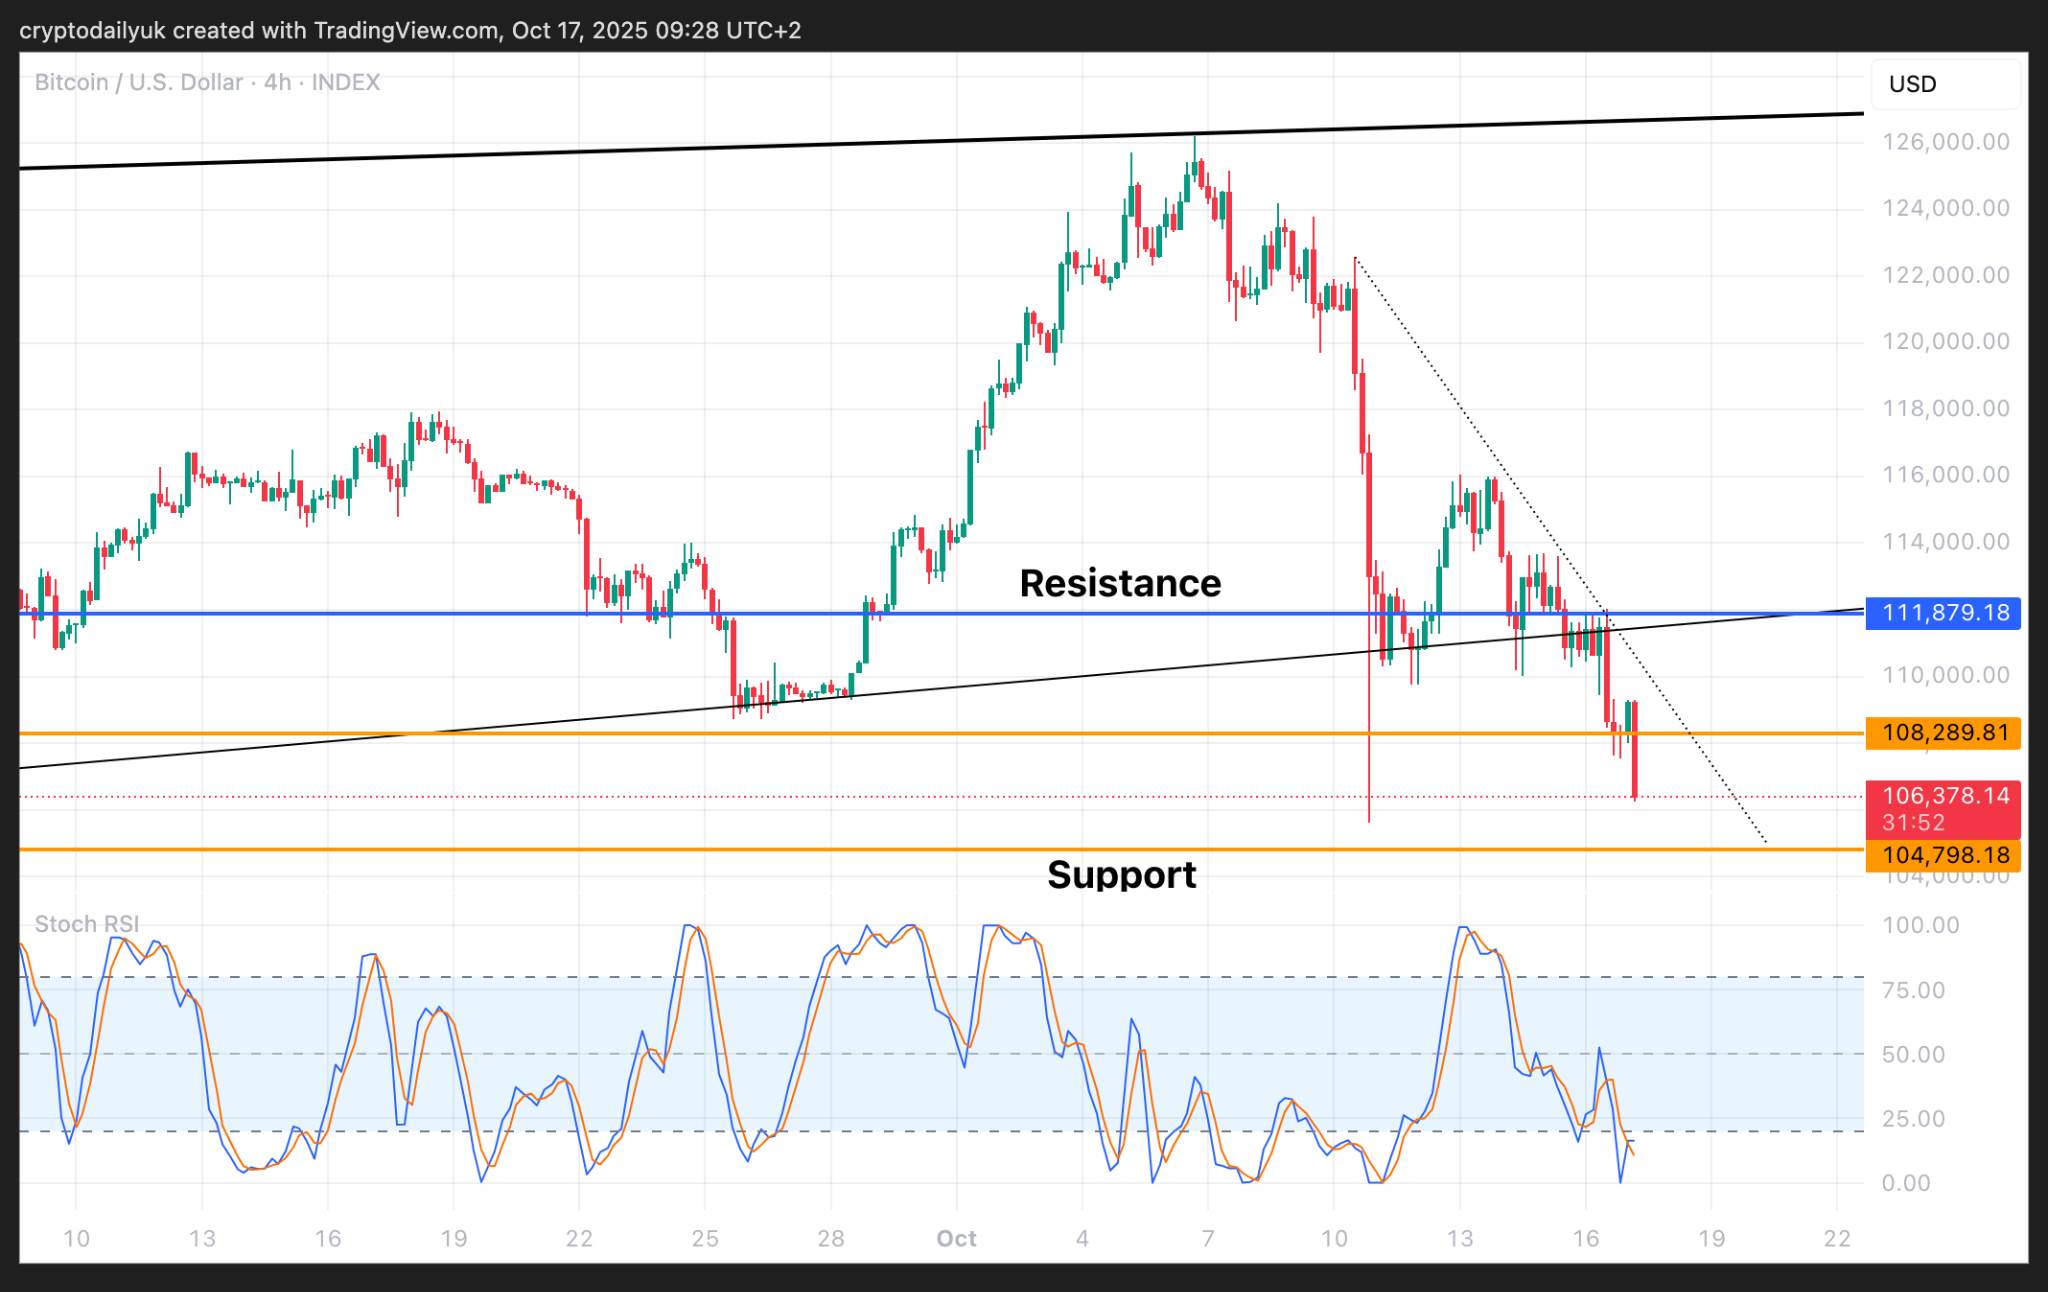
From the short-term chart above, it can be seen that the price of Bitcoin has fallen sharply again. This isn’t like the crazy drop a week ago, when Bitcoin lost thousands of dollars in just a few minutes. But this is an irresistible decline, quickly filling the gap left by the sharp drop last Friday. If the price drops below this level, it could reach even lower lows. Given that the current price of the US stock market may be severely overpriced, the fate of Bitcoin may be sealed.
There is some support at the current price level, with another support level at $106,000. If the price breaks through these supports, $100,000 will become the next support level. Meanwhile, $98,000, which is slightly below that level, seems to be a reasonable target.
Bitcoin has fallen to the medium-term trend line.
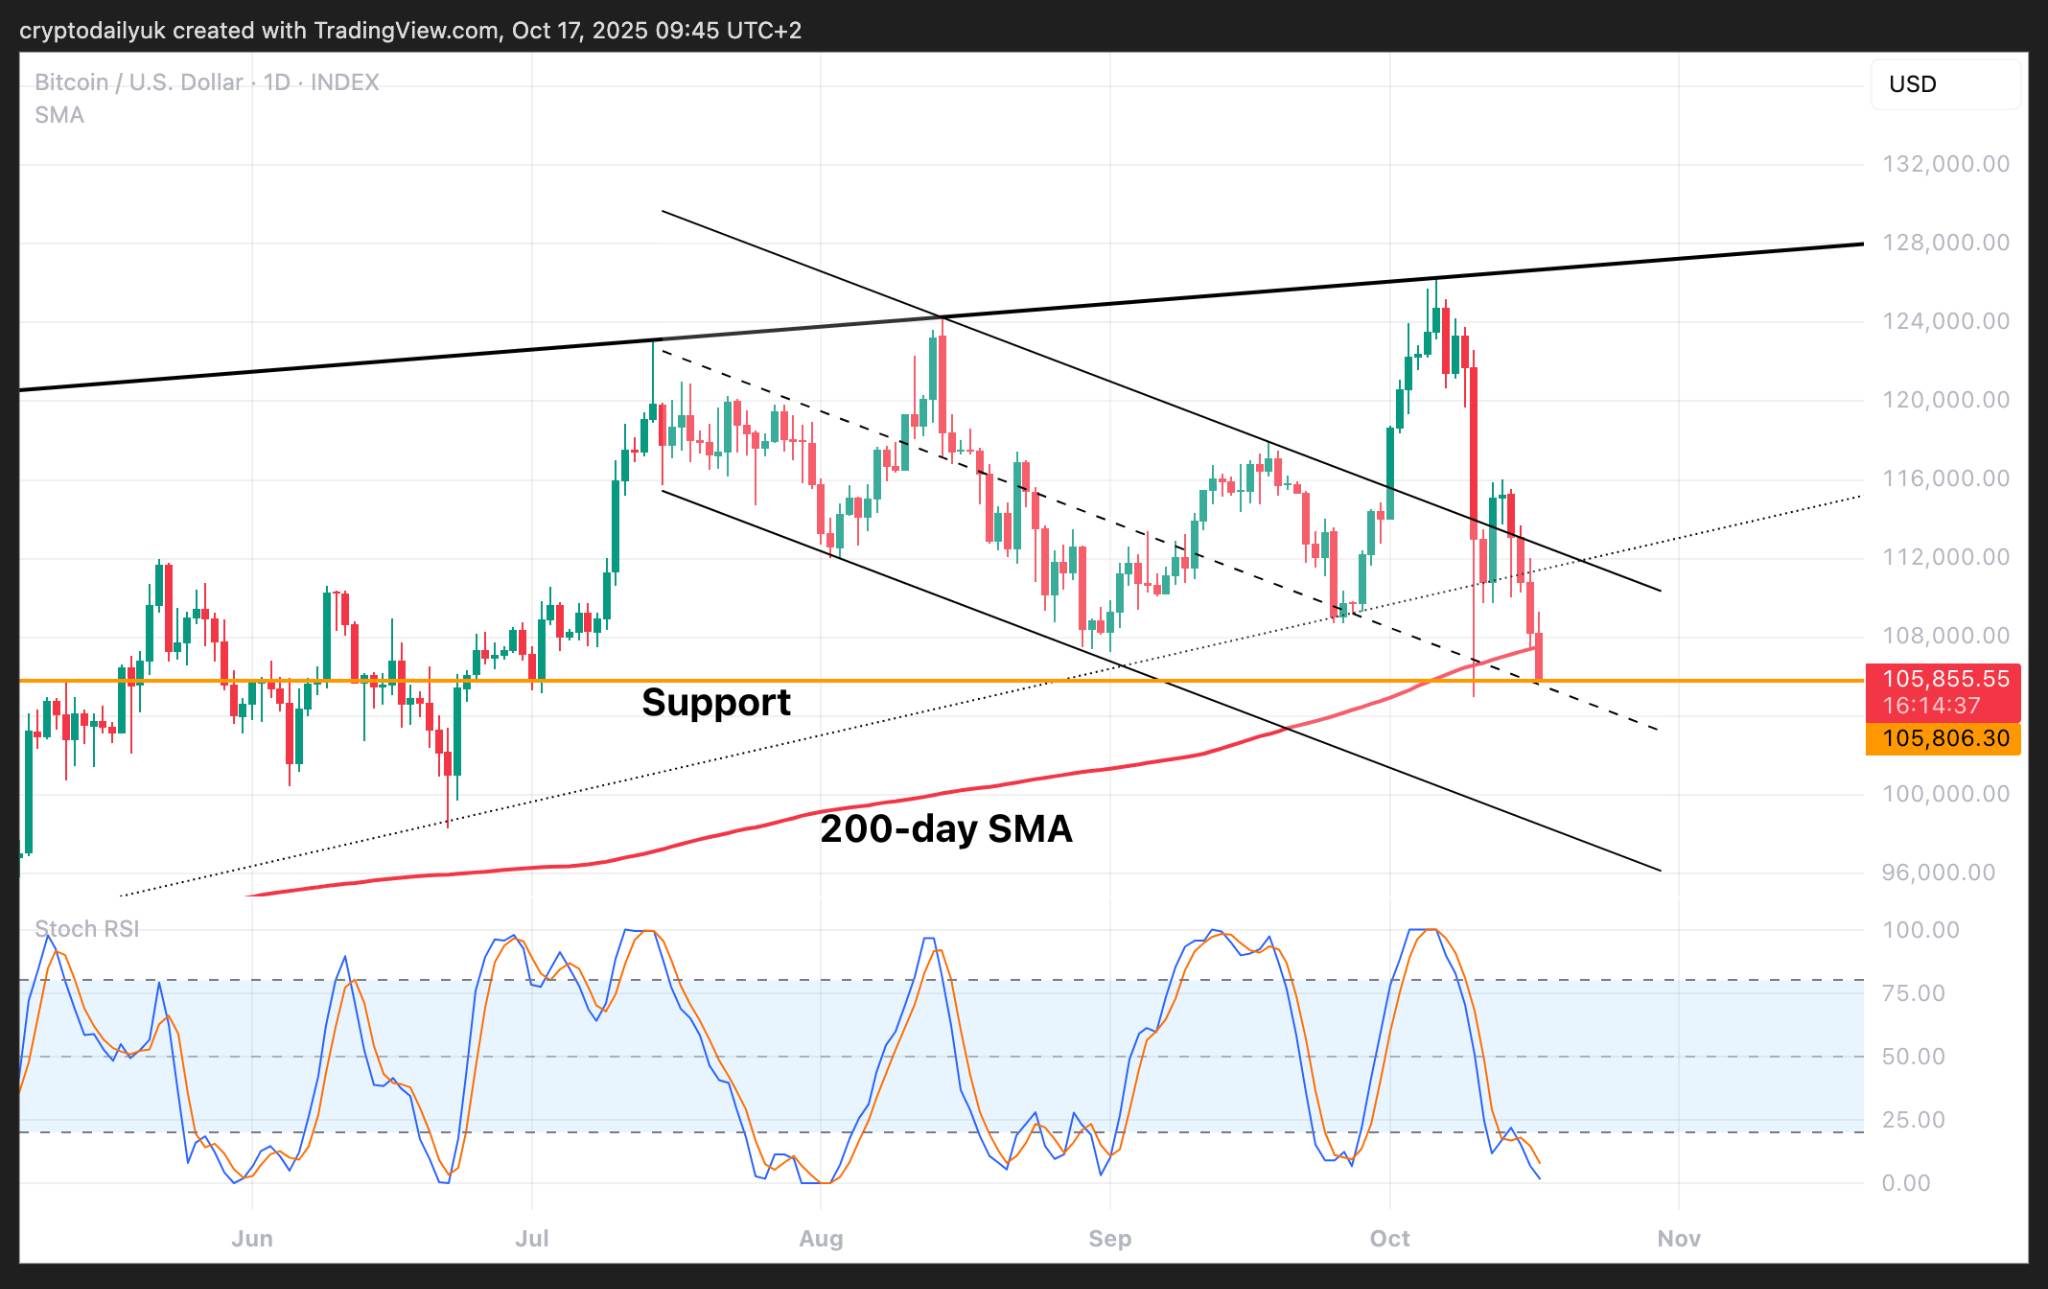
The daily chart shows that prices are in a downward trend, with several false breakouts occurring, eventually reaching new highs. All problems started here: prices re-entered the downward channel, and another false breakout occurred. Currently, prices have fallen back to the middle line of the channel. This could potentially serve as support, especially considering it coincides with the strong support level at $106,000. Moreover, a double bottom pattern has emerged. The 200-day moving average has been broken again. However, if the support level and chart patterns prevent further declines, a rebound may occur, pushing prices back above the 200-day moving average. It’s important to note that this moving average is considered a key support level for the bull market.
The weekly chart of BTC prices highlights the current critical situation of the “King of Cryptocurrencies”. The upward trend line has been broken, and the decline was quite significant. Of course, this week isn’t over yet, so there’s still a chance that some news from the United States could come along and help stabilize Bitcoin. Otherwise, prices seem weak, and further declines could push BTC down to slightly below $100,000 per unit. This might coincide with the bottom of the channel, and a final rebound could occur from there.
The problem is that even if there is some rebound, the bulls might not be able to push prices higher enough. Prices could still fall below the long-term upward trend line. Just achieving a slightly higher high isn’t enough. A real breakthrough in the trend line is needed to avoid entering a bear market.
最后一个积极的方面是,美国需要印制大量法定货币才能展期债务。这可能会给比特币价格带来巨大推动。此外,即使我们已经处于熊市,7万美元也是不错的底部支撑位,而且距离触底也不远了。
截至发稿时, $BTC 价格仍在下跌。目前价格已跌破 105,000 美元,即将触及通道底部,下一站可能是 100,000 美元。