Exchange Ranking
 Top Exchanges
 24h Volume Ranking
 Popularity Ranking
 Exchange BTC Balance
 Proof of Reserves
 Decentralized Exchanges
 Funding Rate
 Funding Heatmap
 Liquidation Data
 Max Pain
 Long/Short Ratio
 Whale L/S Ratio
 Binance/Okex/Huobi L/S
 Bitfinex Margin L/S
 ETF Tracker
 Solana ETF
 XRP ETF
 Hong Kong ETF
 Bitcoin Treasuries
 Crypto Reversal
 Ethereum Reserves
 HyperLiquid Wallet Analysis
 Hyperliquid Whale Watch
 Large Transactions
 On-chain Movement
 Bitcoin ROI
 Stablecoin Market Cap
 Options Analysis
 News
News Articles
 Economic Calendar
 Features
 Wallet
 Contract Calculator


 Security
 Collections
 Watchlist
 Following
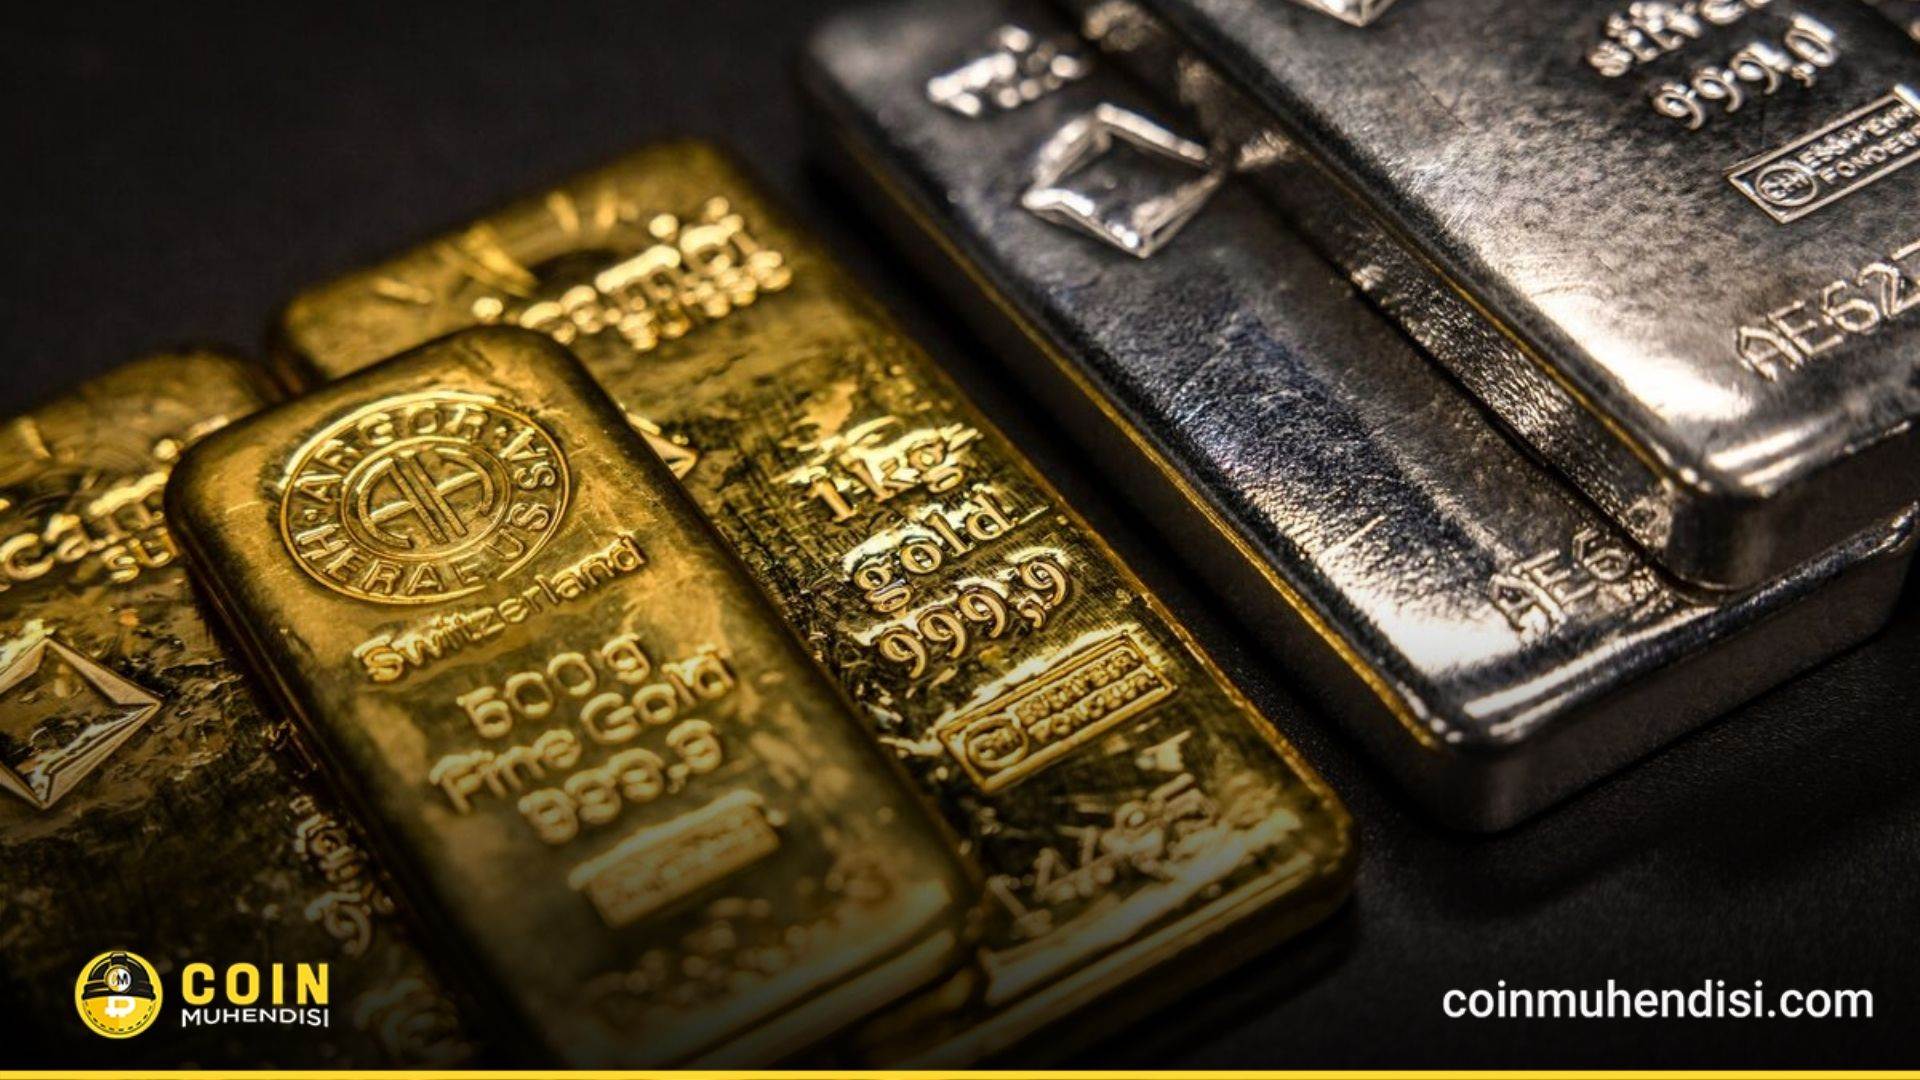
Gold and Silver: Interpreting the Precious Metals Ratio of 66
Recent fluctuations in gold and silver prices have prompted investors to pay renewed attention to the "gold and silver ratio" that reflects the price relationship between the two precious metals. According to analysis data released by the Financial Express, the current price of gold per ounce is about US$4,400, and the price of silver per ounce is about US$66, and the ratio of gold to silver remains at around 66. In long-term assessments, this ratio is often regarded as an important indicator of the balance between the two metals, and runs in the range of 60 to 70 most of the time.
The analysis also pointed out that the Federal Reserve's interest rate policy, the trend of the US dollar, geopolitical events and the gold demand of central banks may all be key factors determining the future performance of precious metals.
What is the ratio of gold and silver? What does it mean?
The gold to silver ratio is a simple but important market indicator that expresses how many ounces of silver are needed to buy one ounce of gold. When the ratio is 66, it means that at current price levels, one ounce of gold requires approximately 66 ounces of silver equivalent to the same value.
If the ratio of gold to silver rises, it means that gold performs stronger or more expensive than silver; conversely, if the ratio falls, it means that silver performs better than gold. Therefore, investors not only use this indicator to track the spread between the two metals, but also use it to assess potential changes in asset value.
Note: The rise to 100 in the gold/silver ratio means that the price difference between the two metals has widened significantly. For example, if the price of gold rises to US$6,600 while silver remains unchanged at US$66, or if gold remains at US$4,400 and silver falls to US$44, the gold to silver ratio could reach 100. Historical data shows that when the ratio of gold to silver is close to 100, the price of gold often fluctuates violently first, and then silver will follow suit. However, past market performance does not guarantee that it will be repeated in the future.
Why does the gold and silver ratio fluctuate in the 60-70 range all year round?
Over the past six months, the gold/silver ratio has mainly fluctuated in the range of 60 to 70. In May alone, the ratio briefly fell below 55. Recently, due to the weaker performance of silver than gold, the gold-silver ratio has rebounded again. It is worth noting that in January 2026, the gold to silver ratio once dropped to a low of 49 due to silver's outperformance of gold. This suggests that the relative performance between different precious metals may change significantly in a short period of time.
Macroeconomic impact on the future of precious metals
Macroeconomic development is expected to play an important role in the future performance of gold and silver. The Federal Reserve's interest rate decisions, the direction of the US dollar exchange rate, stagflation concerns, fiscal expansion and geopolitical risks are all major factors that may lead to fluctuations in precious metals prices. In addition, the continued purchase of gold by central banks is also one of the important factors supporting the market.
According to the Financial Express, since 2022, strong gold purchase demand from central banks has become one of the core driving forces for the rise in gold prices. Whether the central bank will continue to increase its holdings of gold in the future will be a key indicator for observing the trend of the gold and silver ratio and changes in market balance.
Summary and Outlook
The current gold/silver ratio is 66, indicating that the price relationship between the two precious metals is still within the long-recognized range of 60-70. An increase in the ratio suggests the relative strength of gold, while a decline suggests the relative strength of silver. Looking to the future, investors should pay close attention to the Federal Reserve's monetary policy, US dollar movements, geopolitical situation and central bank gold purchases.
If the ratio of gold to silver exceeds 70 or falls below 60 again, it may indicate a new change in the balance between the two metals.