Exchange Ranking
 Top Exchanges
 24h Volume Ranking
 Popularity Ranking
 Exchange BTC Balance
 Proof of Reserves
 Decentralized Exchanges
 Funding Rate
 Funding Heatmap
 Liquidation Data
 Max Pain
 Long/Short Ratio
 Whale L/S Ratio
 Binance/Okex/Huobi L/S
 Bitfinex Margin L/S
 ETF Tracker
 Solana ETF
 XRP ETF
 Hong Kong ETF
 Bitcoin Treasuries
 Crypto Reversal
 Ethereum Reserves
 HyperLiquid Wallet Analysis
 Hyperliquid Whale Watch
 Large Transactions
 On-chain Movement
 Bitcoin ROI
 Stablecoin Market Cap
 Options Analysis
 News
News Articles
 Economic Calendar
 Features
 Wallet
 Contract Calculator


 Security
 Collections
 Watchlist
 Following
 KAS
KAS KAS prices return above US$0.03, approaching key resistance level
Kaspa (KAS) prices rose about 2.5% today, regaining their footing above US$0.03, just one step away from important resistance areas. The rally came after buyers repeatedly tried to defend the $0.025 area. One analyst believes that the resulting technical structure may be preparing for a larger market for KAS.
Cryptocurrency analyst Gopal pointed out that Kaspa's 4-hour chart is forming an "inverted V-shaped head and shoulders" pattern. According to his analysis, the right shoulder is gradually moving towards the neckline of about $0.032. If buyers can break through this barrier, its chart predicts that KAS is expected to rise further to $0.040.
Recent trading data also shows that market interest in Kaspa has increased. CoinGecko data showed that KAS's trading volume exceeded $13 million on September 4, compared with approximately $6.3 million the day before. However, there are differences in volume and price data calculated by different exchanges and data providers.
Kaspa prices approach US$0.032
Gopal's chart shows a clearer inverted V-shaped head, shoulder and bottom structure. The left shoulder was formed in late June, when KAS fell to around $0.026 and then rebounded to the $0.032 area. Prices have since fallen back again, hitting a lower low in August, in the $0.024 - 0.025 range. Analysts identified this second low point as the "head" of the pattern.
The latest rally follows another defense around $0.025, forming the right shoulder that Gopal points to. This makes $0.032 a key neckline.
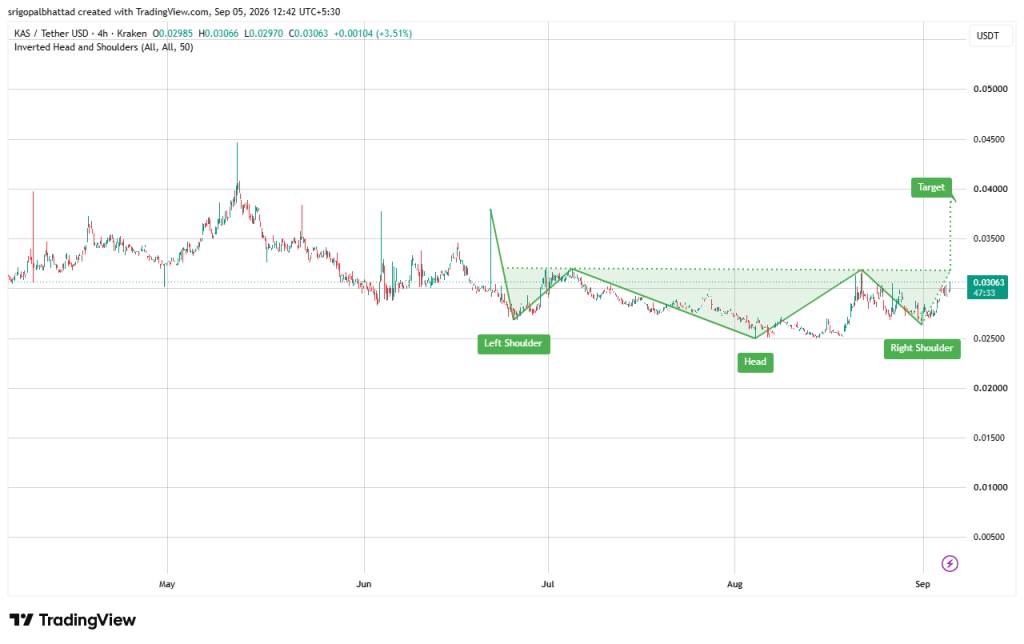
This is crucial because the inverted V head and shoulder shape is not fully confirmed just because three lows appear on the chart. Bulls still need to overcome the resistance of the neckline.
What will happen if KAS breaks through US$0.032?
Analysts 'charts show a target price of around $0.040 if KAS clears neckline resistance. It rose from $0.0306 to $0.040, an increase of about 31%. From the perspective of technical analysis, this goal has certain logical support. The distance between the head (approximately $0.025) and the neckline (approximately $0.032) is approximately $0.007. Projecting this vertical distance above the neckline yields an objective target price close to $0.039-$0.040.
However, the key lies in "if". In the chart provided, KAS has not yet decisively exceeded $0.032. In fact, the area has repeatedly rejected price increases, making it an obvious area where sellers may return. Analysts 'bullish scenarios only strengthen significantly when prices break through $0.032 and then convert it into support. If it is rejected, Kaspa will remain in a broader range of shocks.
The lower boundary is equally important. A loss of $0.025 again would undermine the proposed inverted V-shaped head-and-shoulder structure and weaken the bullish argument for $0.040.
Kaspa's trading activity increases
The emergence of technical forms has been accompanied by an increase in trading activity around KAS. A report released on September 4 showed that Kaspa's 24-hour trading volume increased by nearly 30%, while prices increased by about 4%. The exact percentage depends on the data provider and measurement window; for example, CoinGecko records showed that trading volume on September 4 was approximately $13.17 million, more than double the approximately $6.31 million on September 3.
The broader crypto market environment also contributed to this market. CoinMarketCap's market analysis found that Kaspa's recent upward trend is highly synchronized with the overall crypto market's increase of approximately 3.7%, which means that this market is not entirely driven by Kaspa's unique fundamentals.
Still, stronger trading volume is crucial around key levels such as $0.032. If KAS attacks the neckline with continued trading activity, its rise will be far stronger than a brief low volume breakthrough.
KASPY craze boosts Kaspa community activity
There are also more activities in other areas of the Kaspa ecosystem. According to reports, KASPY, a community-driven Meme coin built on Kaspa, has increased by approximately 55% in the past 30 days and 18% in the past 7 days (as of September 4). This performance far exceeded the performance of KAS during the same period.
The craze for KASPY does not directly create demand for KAS in a way that ensures an increase in Kaspa prices. The performance of Meme coins may also quickly reverse. But it does provide another signal that retail investors are paying increased attention to the Kaspa ecosystem. Combined with higher KAS trading activity and the recent price rebound, speculative interest around Kaspa appears to be stronger now than it was a few weeks ago.
Are Kaspa prices ready for a larger market?
For now,$0.032 is the most critical level. Gopal's inverted V-shaped head and shoulder shape provides Kaspa with a potential path to $0.040, but the shape still needs to be confirmed. KAS trading above $0.030 has brought bulls closer to the neck line, but the technical form has not yet been established.
If it can break through US$0.032 strongly, US$0.035 will become a reasonable intermediate observation area before analysts focus on their larger target of US$0.040. On the other hand, if it is repeatedly rejected around $0.032, KAS may fall back to $0.028 and eventually test the support area of $0.025. Losing $0.025 would weaken the current bullish structure that makes the chart eye-catching.
Rising trading activity, new attention around the Kaspa ecosystem and improved 4-hour technical structure have provided bulls with what they have lacked in recent declines: a clear upward path. But the breakthrough they are waiting for has not yet been confirmed.