Exchange Ranking
 Top Exchanges
 24h Volume Ranking
 Popularity Ranking
 Exchange BTC Balance
 Proof of Reserves
 Decentralized Exchanges
 Funding Rate
 Funding Heatmap
 Liquidation Data
 Max Pain
 Long/Short Ratio
 Whale L/S Ratio
 Binance/Okex/Huobi L/S
 Bitfinex Margin L/S
 ETF Tracker
 Solana ETF
 XRP ETF
 Hong Kong ETF
 Bitcoin Treasuries
 Crypto Reversal
 Ethereum Reserves
 HyperLiquid Wallet Analysis
 Hyperliquid Whale Watch
 Large Transactions
 On-chain Movement
 Bitcoin ROI
 Stablecoin Market Cap
 Options Analysis
 News
 Articles
 Economic Calendar
 Features
 Wallet
 Contract Calculator


 Security
 Collections
 Watchlist
 Following
The latest correction of gold prices to a critical position, and next week's trend may determine the overall pattern.
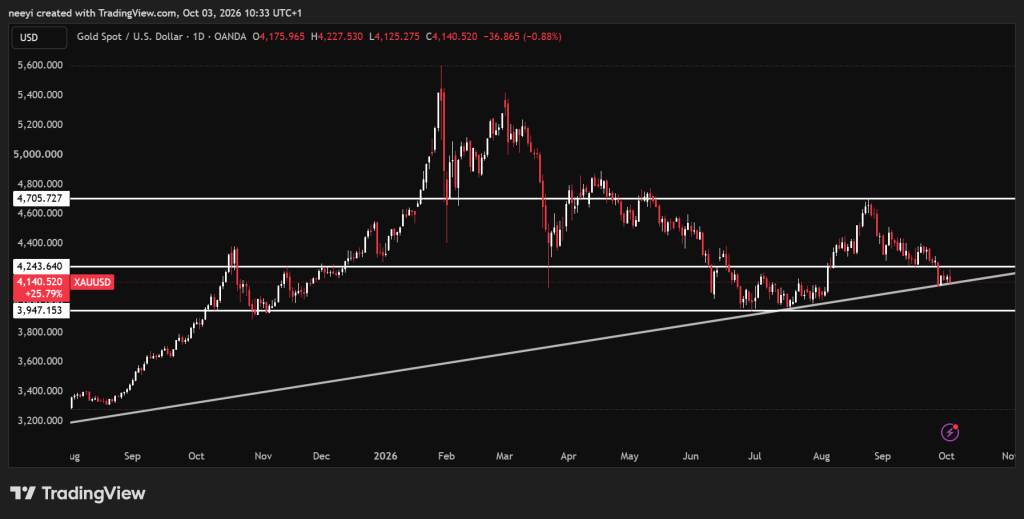
The latest correction of gold puts its price at a critical level, and the impact of its next move will exceed the short-term fluctuations in the next few days. The figure shows that precious metals prices are close to a support line that tracks their larger upward trend. Analyst Rashad Hajiyev believes next week's trend will determine whether this technical structure can be maintained.
His view favors a rebound in gold prices from current levels. However, before the technical arguments for "bullish" become more solid, gold prices still need to break through nearby resistance levels. What the chart currently presents is a straightforward test: Does the latest decline end with another rally, or does it evolve into a deeper correction?
Gold prices test uptrend line behind recovery
Looking at the gold chart, you can see that an uptrend line extending from the early rising phase into the current price area is working. The circled section marks where the latest correction meets this trend line, which is close to the gold price offered at $4,140.
The broader context helps explain why this test is crucial. Gold has previously climbed from lower levels, peaking at a high near $5,600. There was a sharp correction, followed by a rebound towards $4,700 that failed to bring prices back to previous highs.
This sequence puts gold at an important juncture. A longer uptrend structure is still visible, but the recent rebound is already facing resistance. Another rally helps preserve the larger trend, but it does not automatically mean the correction is over.
Over the past week, gold has been relying on two major large-cycle uptrend lines. Next week will be a decisive week. My guess is that gold should hold on and start a new round of gains from here...
-- Rashad Hajiyev (@hajiyev_rashad) October 3, 2026
Hajiyev said that gold has been operating on a major uptrend line spanning two years in the past week. He expects prices to stabilize in the region and start another round of gains.
His view depends on whether the support level continues to be effective. Repeatedly touching the trend line can indicate that buyers are defending that position, but contact alone does not confirm that a recovery has begun.
Gold prices need to break the $4,240 resistance to develop a recovery.
The $4,240 resistance immediately above the current price is the next test point. Gold prices may hold on to the trend line but still struggle below this level, which will leave the recovery incomplete.
A breakthrough of $4,240 will be an initial signal that the latest downward momentum is weakening. A more ideal result would be to continue trading above that level after a breakthrough, rather than a brief move followed by a rapid reversal.
The main upside checkpoints are as follows:
- $4,240 is the immediate resistance level: Continued breakthroughs will strengthen the case for a rebound from trend line support.
- $4,700 is the next target: The region is close to the recent rebound high visible on the chart.
- Above $5,600 is a broader expansion area: Gold prices need to break through the middle resistance level and hit a new high to become realistic.
It is important to distinguish between these levels. Reaching $4,700 will recover some of its losses, but gold will still be below its previous peak. Breaking through $5,600 will have greater structural significance because it will establish a new historical high.
This large result may take weeks or even months to achieve. The first requirement remains a convincing response from current support levels and a breakthrough of $4,240.
 XAUUSD Price Chart / TradingView.com
Gold prices face deep correction risks if trend line support fails
The downside scenario begins when gold loses its uptrend line. An effective break below this line will weaken the view that a greater level of rise is ready from current levels.
The next support level available is $3,950. If the trend line fails, this will become an important checkpoint in the next few days. A rebound from the region can limit losses, although gold prices will then need to regain the trendline that was breached to improve the situation.
If $3,950 weakens further,$3,400 will become the focus of discussions in the coming weeks. Such a decline would represent a much deeper setback and would undermine the rising structure behind Hajiyev’s bullish expectation. (Such a decline would represent a more serious setback and would undermine the upward structure behind Hajiyev's bullish expectations.)
FAQs
Who is buying gold?
Central banks, especially those in emerging market economies, are buying most of the world's gold to diversify reserves and reduce dependence on the U.S. dollar. You can learn more through World Gold Council data tracking official reserve statistics.
How high can gold prices rise in 2026?
Major financial institutions predict that gold prices will reach between $4,900 and $6,300 per ounce by the end of 2026, based on expectations based on an intra-year high of more than $5,590 in January.