Exchange Ranking
 Top Exchanges
 24h Volume Ranking
 Popularity Ranking
 Exchange BTC Balance
 Proof of Reserves
 Decentralized Exchanges
 Funding Rate
 Funding Heatmap
 Liquidation Data
 Max Pain
 Long/Short Ratio
 Whale L/S Ratio
 Binance/Okex/Huobi L/S
 Bitfinex Margin L/S
 ETF Tracker
 Solana ETF
 XRP ETF
 Hong Kong ETF
 Bitcoin Treasuries
 Crypto Reversal
 Ethereum Reserves
 HyperLiquid Wallet Analysis
 Hyperliquid Whale Watch
 Large Transactions
 On-chain Movement
 Bitcoin ROI
 Stablecoin Market Cap
 Options Analysis
 News
 Articles
 Economic Calendar
 Features
 Wallet
 Contract Calculator


 Security
 Collections
 Watchlist
 Following
 XRP
XRP futures showed a decline in open interest, while a rise in net positions pointed to short covering rather than new leverage demand.
During today's latest trading session, as trading volume expanded, XRP prices broke through from the US$1.55 level and are currently moving towards the US$1.45 -1.46 range. Although net outflows from exchanges are still frequent during the rebound, the next direction of rise and fall of XRP cannot be determined based on the capital flow data alone.
The current focus on the XRP market outlook is whether there will be a significant trend reversal after the rebound of the target price of US$1.55, while observing the limitations of futures positions and continued exchange outflows to measure whether more leveraged funds will return to the market.
Futures positions remained restrained
XRP began to rebound after bottoming out in late July and entered a long-term consolidation phase. The initial rise was accompanied by a significant expansion in trading volume. A second rebound occurred in late September, pushing prices closer to another high. <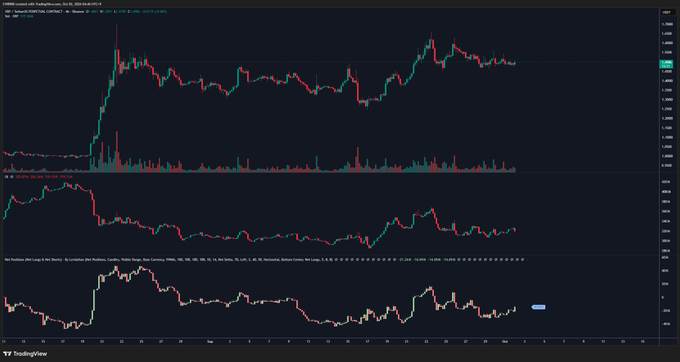 > Source: XOpen
During the September rally, Open Interest increased, indicating increased participation in derivatives. However, after local price highs, open interest fell. As a result, the latest readings point to market stabilization rather than aggressive leverage expansion.
CW noted that open interest contracts fell slightly, while net position Delta (change) increased. This observation also suggests that current market activity is mainly short covering. If new upward pressure is to emerge, both indicators need to rise at the same time.
Derivatives charts support the distinction between "covering" and "opening" positions. Net positions improved during the September rally and then decreased as prices fell. Recently, the indicator has started to rise again.
Price reversal test key point
XRP reached about $1.54-$1.55 after building momentum around $1.52. Several attempts to break through the area failed, forming obvious resistance near intraday highs. Subsequently, as selling pressure increased, the price fell back below $1.50. <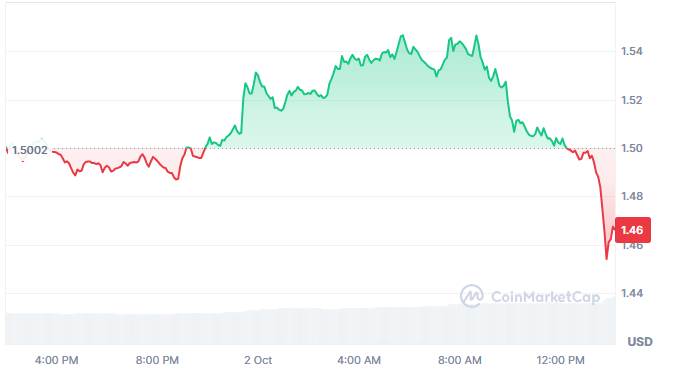 > Source: Coinmarketcap
The latest data shows that the XRP price is about US$1.46, down 1.95% in 24 hours. Despite the decline, XRP has gained 4.97% in the past seven days. During this period, trading volume reached approximately US$4.29 billion.
Trading volume increased by 49.31%, indicating that the range of activity during the reversal process has significantly widened. According to the data provided, the market value is approximately US$92.66 billion. Based on 63.09 billion in circulation XRP, the fully diluted valuation is approximately US$146.87 billion.
The $1.50 level now provides a near-end reference for short-term price behavior. If it can return above that level, attention may return to $1.52. If it strengthens further, the $1.54 -1.55 resistance area will once again become the focus.
Exchange funds flows still bias towards net outflows
XRP funds flow data shows frequent negative net inflow readings during the period shown. Between December and January, large-scale net outflows occurred many times. Drawbacks on some days amount to approximately $40 million to $70 million. <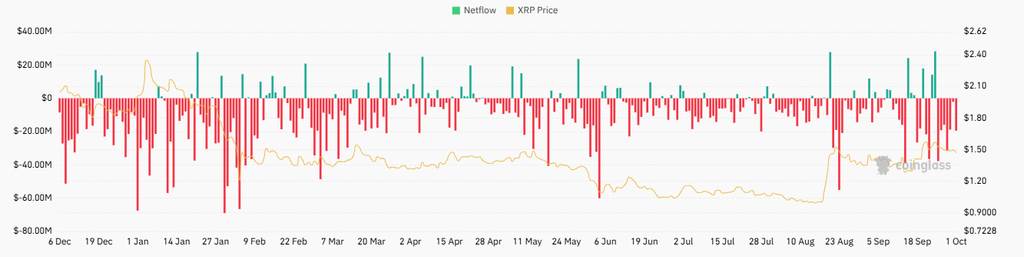 > Source: Coinglass
Despite occasional spikes in inflows, negative readings persisted into February and May. There was another large-scale net outflow period at the end of May and early June. During that weak period, XRP was also trading in the $1.00 -1.20 range.
A stronger price recovery occurred in late August, with prices moving towards $1.50. Since then, exchange funds flows have continued to alternate between positive and negative readings. During September, there were several huge green (inflow) peaks next to the persistent red line (outflow).
The latest capital flow data is still mixed, but is generally biased towards withdrawals. However, exchange outflows alone cannot establish the future direction of prices. Therefore, combined with the data, prices, futures positions and capital flows are still independent signals.