Exchange Ranking
 Top Exchanges
 24h Volume Ranking
 Popularity Ranking
 Exchange BTC Balance
 Proof of Reserves
 Decentralized Exchanges
 Funding Rate
 Funding Heatmap
 Liquidation Data
 Max Pain
 Long/Short Ratio
 Whale L/S Ratio
 Binance/Okex/Huobi L/S
 Bitfinex Margin L/S
 ETF Tracker
 Solana ETF
 XRP ETF
 Hong Kong ETF
 Bitcoin Treasuries
 Crypto Reversal
 Ethereum Reserves
 HyperLiquid Wallet Analysis
 Hyperliquid Whale Watch
 Large Transactions
 On-chain Movement
 Bitcoin ROI
 Stablecoin Market Cap
 Options Analysis
 News
News Articles
 Economic Calendar
 Features
 Wallet
 Contract Calculator


 Security
 Collections
 Watchlist
 Following
 M
M $M quietly accumulated momentum, holding steady around $1.1275 and rising more than 8%.
$M (ThisMemeCore) is quietly accumulating momentum, rising more than 8%, while building a tight consolidation foundation around $1.1275. Traders following the chart are closely watching a potential breakout pattern, and once resistance is broken, prices are expected to move further higher. This ThisMemeCore price forecast provides a detailed breakdown of key price points on the chart, clearing activity, and the most important support and resistance areas currently.
Market data as of September 5, 2026, 11:27 am Indian Standard Time.
Market Overview
Indicator Value Price $1.127524 Hours Change +8.09% Market Value $2.55 billion Current Market Value $2.69 billion Volume (24 hours)$1.59 million (-17.12%) Volume/market value ratio (24 hours)0.06463% Fully diluted valuation (FDV)$11.27 billion Total supply 5.41 billion M Maximum supply 10 billion MC Circulation supply 2.26 billion M Source: CoinMarketCap, as of September 5, 2026, 11:27 am Indian Standard Time. Data from different tracking sites may differ slightly.
MemeCore Clearing and Volume Data Analysis
Futures Clearing Data (Source: Coinglass):In the past hour, the clearing amount was $7.04, all from short positions. Over a 4-hour period, the total clearing amount reached $244.99 (long $237.95, short $7.04). The total 12-hour clearing amount was $363.40 (long $237.95, short $125.45), while the total 24-hour clearing amount was $1,320 (long $630.82, short $693.40).
Futures volume by exchange (Source: Coinglass):BingX led with $2.3 million in volume, followed by Binance with $2.08 million and WhiteBIT with $1.59 million. KuCoin recorded $1.57 million, LBank $1.35 million, Bybit $918.43 million, with Gate and Bitunix contributing smaller volumes.
The above futures data are counted separately from CoinGecko spot volume data.
$M Chart Analysis: Today's Price Trend and Outlook
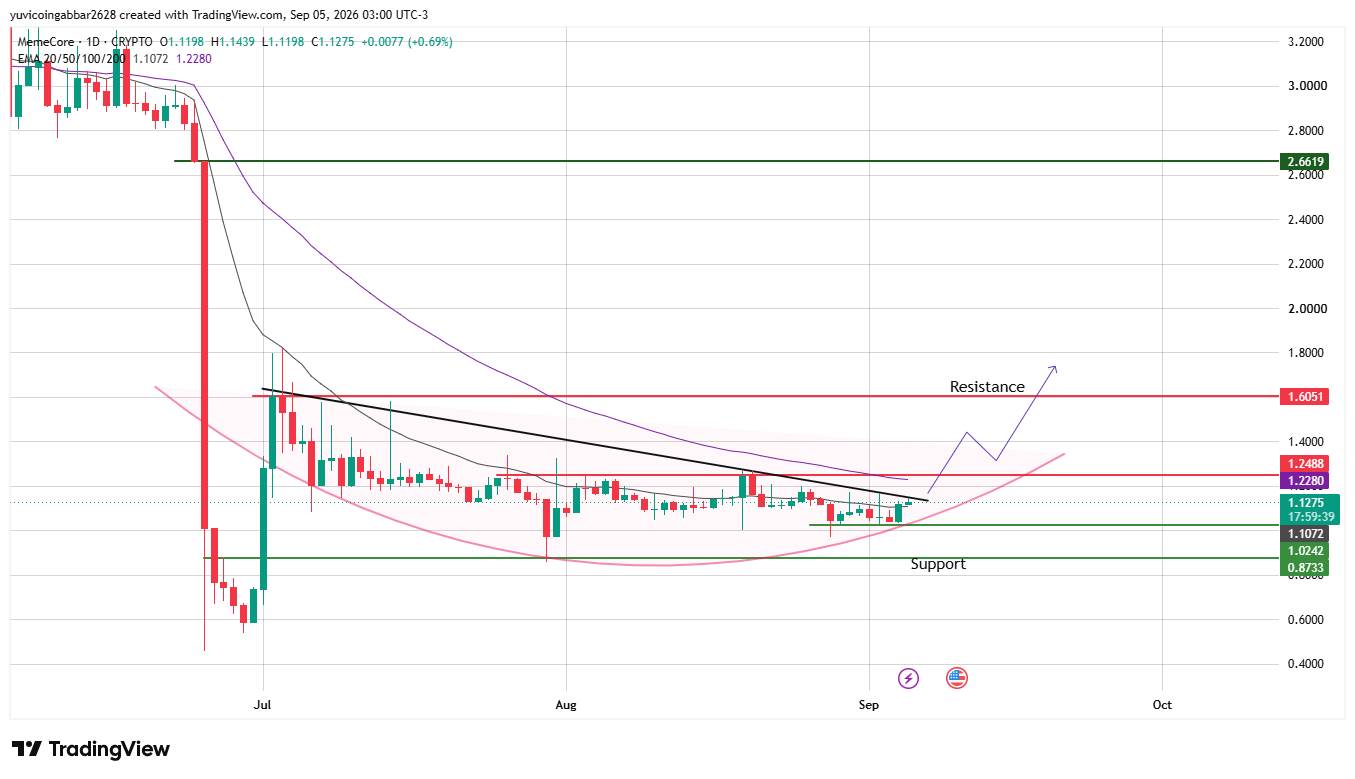
$M's EMA 20 is at 1.1072, and EMA 50 is at 1.2280. The current price is slightly above the EMA 20, but still below the EMA 50 and is compressing between a downtrend line and resistance around $1.2488. Over the past few weeks, price movements have been volatile around this trend line. If we can break through cleanly and stand above the trend line, it will be a signal worth noting, because prices have tested the area many times before but have failed to effectively break through.
 MemeCore 2026 Price Forecast: Key Prices to Focus on
Type Price Current Reference Price $1.1275 Recent Support $1.0242 Deep Support $0.8733 Initial Resistance $1.2488 Main Resistance $1.6051 Extended Resistance $2.6619 Bull Market Scenario vs Bear Market Scenario
Bull Market Scenario: If $M remains above $1.0242, the consolidation base will remain intact. If you can break through and stand firm above $1.2488, it will confirm that the trend line has broken through, opening up the path to $1.6051; if momentum continues to increase,$2.6619 can be used as a longer-term target price.
Bear market scenario: If $1.0242 support is lost, the current structure will be destroyed and there is a risk of slipping to $0.8733. If the close is below $0.8733, the bullish pattern fails and points to a deeper correction rather than a breakthrough.
$M Price Scenario: Triggers and Failure Points
Scenario Triggers Possible outcomes Failure Points Trend Line Recedes (Bullish) Breakthrough and Stabilizes $1.2488 Upward $1.6051 Move back to close below $1.2488 Consolidating prices within the channel remain between $1.0242 and $1.2488 Continue to consolidate and break through any boundary channel break (bearish) close at $Falling below 1.0242 to near $0.8733 and recovering $1.0242 MemeCore price forecast: Can $M hit $2.6619?
$2.6619 is the highest resistance level visible on the daily chart.$ M first needs to clear the $1.2488 barrier and then stand firm above the EMA 50 (1.2280) to make $1.6051 a halfway target. To reach $2.6619, a sustained, multi-stage rally is needed, which is far from achievable by a single action and must break beyond the current trend line.
MemeCore Outlook: Expert Opinion
According to CoinGabbar analysts, this ThisMemeCore price forecast depends entirely on the trend line around $1.2488. Before this position was accompanied by a breakthrough in trading volume, it was still in a wait-and-see stage rather than a certain trend. Traders should pay close attention to $1.0242, a key level to maintain the current bullish pattern alive.
Disclaimer
This document is for information purposes only and should not be regarded as financial advice. The cryptocurrency market is highly volatile. Be sure to conduct independent research before making any investment decisions.