Exchange Ranking
 Top Exchanges
 24h Volume Ranking
 Popularity Ranking
 Exchange BTC Balance
 Proof of Reserves
 Decentralized Exchanges
 Funding Rate
 Funding Heatmap
 Liquidation Data
 Max Pain
 Long/Short Ratio
 Whale L/S Ratio
 Binance/Okex/Huobi L/S
 Bitfinex Margin L/S
 ETF Tracker
 Solana ETF
 XRP ETF
 Hong Kong ETF
 Bitcoin Treasuries
 Crypto Reversal
 Ethereum Reserves
 HyperLiquid Wallet Analysis
 Hyperliquid Whale Watch
 Large Transactions
 On-chain Movement
 Bitcoin ROI
 Stablecoin Market Cap
 Options Analysis
 News
News Articles
 Economic Calendar
 Features
 Wallet
 Contract Calculator


 Security
 Collections
 Watchlist
 Following
Bulla price forecast discussions heat up: surged 87.74% in 24 hours
According to Coinglass data, BULLA surged 87.74% in 24 hours, trading at close to US$0.0604, and has a market value of approximately US$60.11 million, which triggered heated discussions on Bulla price trends. 
The market came just one day after Websea announced on X (formerly Twitter) that it would open $BULLA perpetual contract trading at 10:00 UTC on September 4, 2026. This transaction provides long and short two-way positions and flexible leverage. 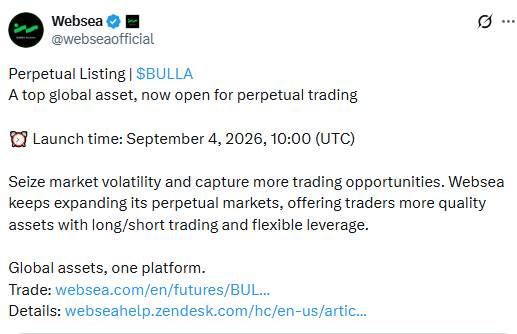
This news of the launch of $BULLA, coupled with the large-scale wave of forced short liquidations in the Binance derivatives market, seems to be the direct driving force of this price surge.
Why are Bulla prices rising today?
The current rally looks more like a squeeze on leveraged short positions than an influx of fresh buying. Coinglass clearing data showed that in the past 24 hours, short positions were cleared as much as $1.39 million, while long positions were only $177,260. This imbalance also exists in the 1-hour, 4-hour and 12-hour time windows. 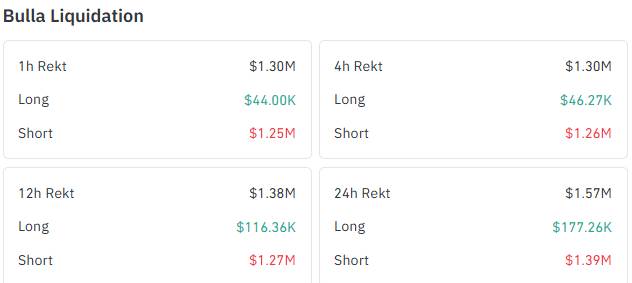
Binance's basic account long-short ratio is 0.8751, indicating that more accounts are in short positions; however, the former trader's position ratio is 1.0489, indicating that large traders are slightly biased towards long positions. 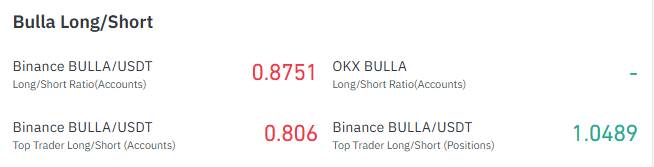
This mixed position structure, combined with Websea's online announcement, provides conditions for short squeeze.
Bulla Open Interest and Derivatives Positions Analysis
Coinglass data showed that BULLA's open interest soared to a record high of nearly US$37.4 million, and then fell back to approximately US$26.14 million as prices continued to climb. This suggests that most leveraged short positions have been squeezed out of the market, rather than that new demand is accumulating. 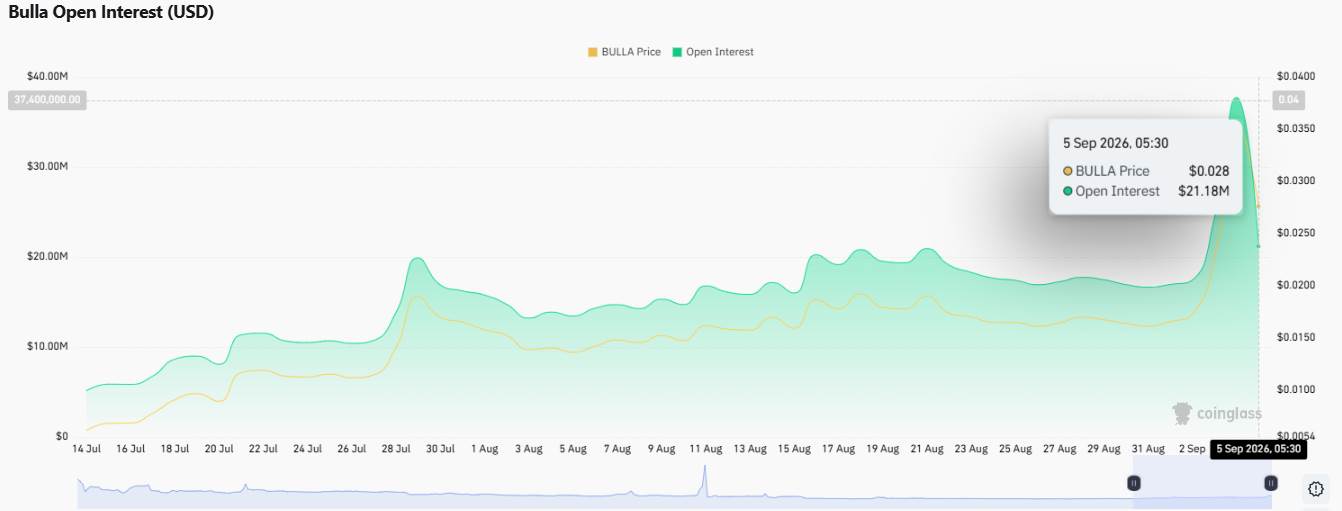
Futures trading volume is mainly concentrated in Binance, which is approximately US$127.4 million, with Aster and Gate contributing US$18.91 million and US$8.37 million respectively.
Bulla's price trend performance in 2026
Bulla's technical analysis chart shows that the market is in a transition period: Coinglass data shows that BULLA has gained 317.01% in the past 30 days 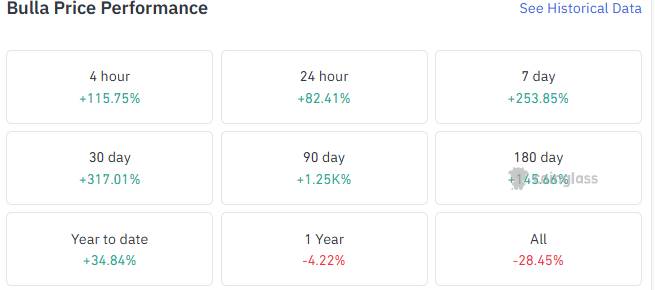 , 1,250% in the past 90 days, and 145.66% in the past 180 days. Although the year-to-date increase is 34.84%, it is still down 4.22% from a year ago and 28.45% since its all-time high.
Bulla weekly chart technical outlook
BULLA's TradingView weekly chart shows that prices are consolidating around US$0.004046, then entering an upward channel to US$0.024641, and a huge green candle breaks through US$0.048059. Reach the current level of US$0.061008. 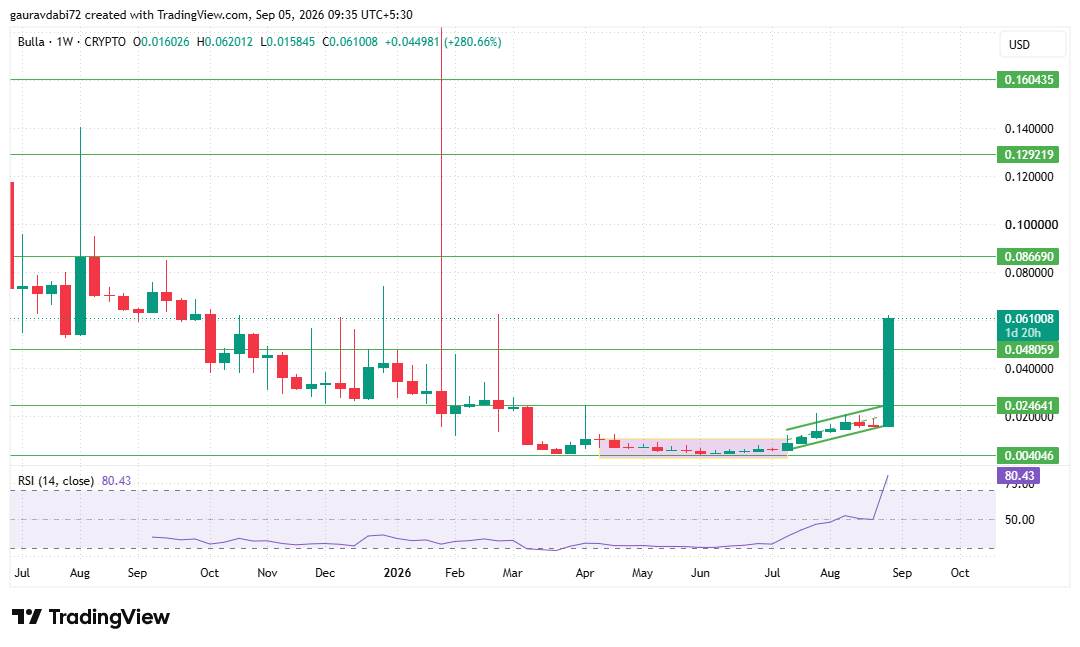
The RSI(14) indicator is 80.43, confirming this volatility as an overbought condition. If it can remain above US$0.048059 and buying pressure continues, the upside target may point to US$0.086690, US$0.129219 and US$0.160435; if there is a correction, US$0.048059, US$0.024641 and US$0.004046 will become key support levels again.
2026 Bulla Price Forecast: Can BULLA Tokens Continue Their Rise?
To make this Bulla price forecast structurally meaningful, you need to pay close attention to the immediate area above, the next resistance area near US$0.0867. If a confirmed close is above this region, it could open a path to the $0.1292 and $0.1604 areas marked on the chart, although these two positions are still below BULLA's previous 2026 highs.
On the downside, if the short squeeze loses momentum, US$0.0481 is the first support level to focus on, while US$0.0246 is the deeper buffer at the bottom of the rising channel. These levels are not absolute guarantees, and an overbought RSI indicator increases the likelihood of a sharp correction before any further gains.
Expert Opinion
According to CoinGabbar's team of analysts, rallies based on on-line catalysts and a large number of short liquidations tend to be more mechanical rather than driven by fundamentals. For tokens with such a concentrated holder base, movements at such speeds usually bring about sharp two-way fluctuations rather than a smooth continuation.
Key Risks and Observation Points
In addition to price behavior, Bulla's on-chain structure also poses significant risks. BscScan holder data shows that the top 100 wallets control 98.90% of the circulating supply, of which only four wallets are classified as "whales", accounting for 86.68% of the market value, although they account for less than 0.01% of all holders. 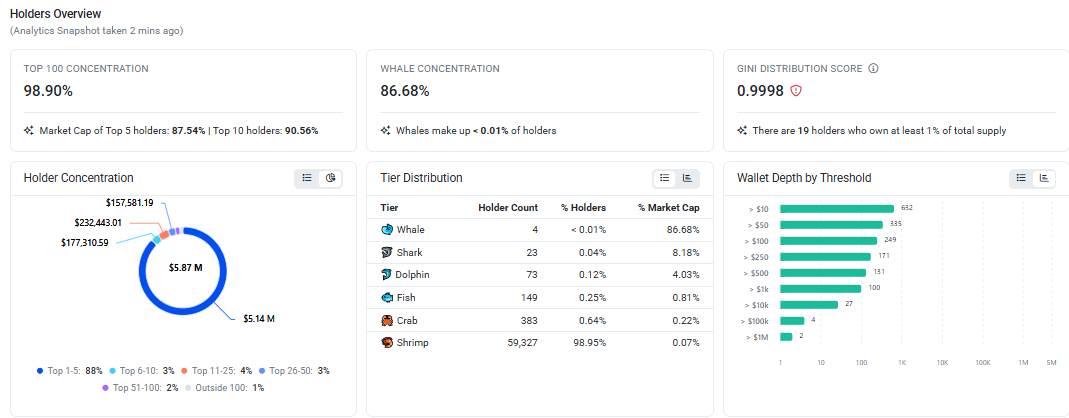
The Gini distribution score is 0.9998, and 19 wallets each hold at least 1% of the total supply, indicating abnormally concentrated whale activity. This means that a few large holders have disproportionate influence on future price movements. This concentration of holders is common in small-cap tokens across the altcoin market, but if any large wallet moves chips, it does trigger sudden volatility risks. Traders should also pay close attention to open interest contracts, which are still adjusting rapidly after recent surges and pullbacks.
Conclusion
Bulla's surge in the past 24 hours combines a new sustainable launch catalyst from Websea, aggressive short squeeze in the Binance derivatives market, and a technical form that breaks through months of consolidation. The sustainability of this market depends on whether buyers can absorb profit-taking orders in the upper resistance zone, while the market absorbs extremely overbought RSI readings and high concentration of holders.
Disclaimer :This article is for reference only and does not constitute financial advice. The cryptocurrency market is extremely volatile, and readers should conduct their own research before making any investment decisions.