Exchange Ranking
 Top Exchanges
 24h Volume Ranking
 Popularity Ranking
 Exchange BTC Balance
 Proof of Reserves
 Decentralized Exchanges
 Funding Rate
 Funding Heatmap
 Liquidation Data
 Max Pain
 Long/Short Ratio
 Whale L/S Ratio
 Binance/Okex/Huobi L/S
 Bitfinex Margin L/S
 ETF Tracker
 Solana ETF
 XRP ETF
 Hong Kong ETF
 Bitcoin Treasuries
 Crypto Reversal
 Ethereum Reserves
 HyperLiquid Wallet Analysis
 Hyperliquid Whale Watch
 Large Transactions
 On-chain Movement
 Bitcoin ROI
 Stablecoin Market Cap
 Options Analysis
 News
News Articles
 Economic Calendar
 Features
 Wallet
 Contract Calculator


 Security
 Collections
 Watchlist
 Following
 XRP
XRP XRP breaks through key resistance levels, with analysts predicting a target price of as high as US$5.20.
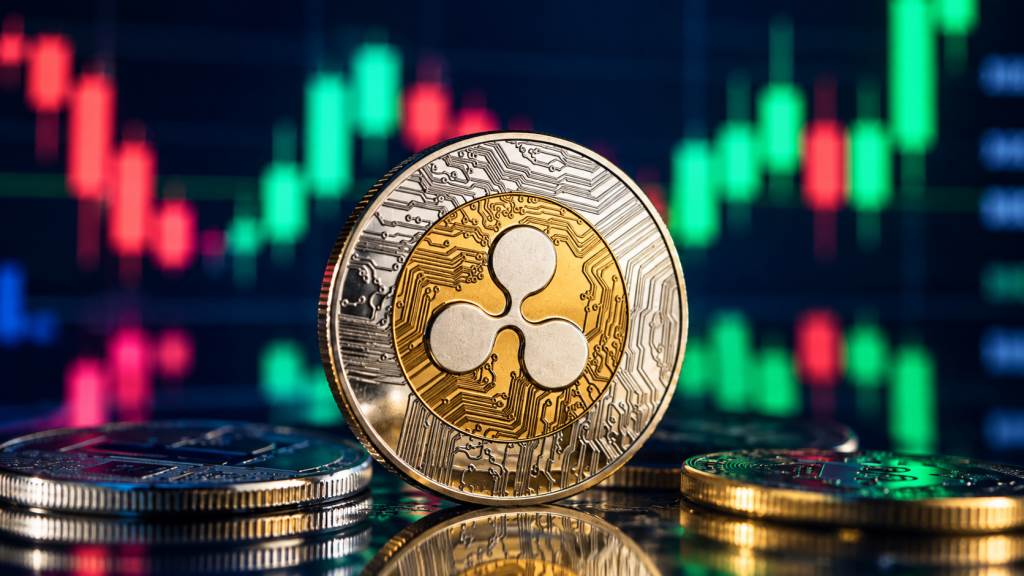
XRP, a digital asset that is the core driving force of Ripple's payment network, has recently successfully broken through key resistance levels after more than a year of selling pressure. Previously, the asset had been in a situation where it had been gradually decreasing at the weekly high point for a long time and was repeatedly blocked at the downtrend line. However, market momentum changed significantly in late August 2026.
Breakthrough Trend and Analyst Views
Cryptocurrency analyst Gina (@Gina_XRP), who closely follows the XRP weekly chart, has warned followers of potential upside opportunities. As assets broke through the long-standing downtrend line strongly, XRP soared rapidly, achieving a 50% increase in less than three days, far exceeding Gina's previous forecast.
Although prices subsequently showed a slight correction, Gina emphasized its continued optimism. She advises investors not to expect an immediate reversal in trends. Gina pointed out that recent market trends have verified her previous predictions and further outlined the next price target for the digital asset.
Gina said a 50% rise from the benchmark level she has locked in is just the beginning. "Don't expect XRP to fall too soon," she explained while sharing the new target sequence:
- $1.34
- $1.17
- $1.90
- $3.10
- $5.20
Short-term and long-term price targets
Gina's updated outlook presents a two-stage development path. In the first phase, she expects XRP to fall back from $1.34 to $1.17, marking $1.17 as a so-called "Reload Zone", a potential accumulation area. Later, she predicted that the price would rise back to $1.90. In the subsequent second phase, her goal scope expanded further. She expects prices to advance from $1.90 to $3.10, and ultimately predicts that the top will reach $5.20, which is above the all-time high of $3.65 set in 2025.
Noun explanation: XRP is a local digital currency for Ripple Payment Protocols, designed for fast, low-cost cross-border transactions between financial institutions.
Technical Structure and Volume Analysis
This breakthrough in XRP ended the consolidation period that began in July 2025. During this period, the asset reached a lower high in each rally. The downtrend line on the weekly chart has always served as a hard resistance level and has resisted price increases at five different points in time.
During the downward consolidation period, trading volume was relatively sluggish. The breakthrough in late August was accompanied by a sharp surge in trading activity, which was in sharp contrast to the previously dull price behavior on the chart. The weekly chart highlighted five failed attempts to break through the downtrend line before the August breakout, which was accompanied by a significant increase in volume.
Analysts remain bullish
Gina is known for its early warnings to followers about the XRP layout. She reiterated her firm belief that the current upward movement is not yet complete. Although there was a correction after the initial surge, she did not adjust her price target. Based on her roadmap, she sees $5.20 as the ultimate goal for the current cycle. Gina's consistent analysis has attracted the attention of traders trying to understand the medium-to long-term trajectory of XRP.