Exchange Ranking
 Top Exchanges
 24h Volume Ranking
 Popularity Ranking
 Exchange BTC Balance
 Proof of Reserves
 Decentralized Exchanges
 Funding Rate
 Funding Heatmap
 Liquidation Data
 Max Pain
 Long/Short Ratio
 Whale L/S Ratio
 Binance/Okex/Huobi L/S
 Bitfinex Margin L/S
 ETF Tracker
 Solana ETF
 XRP ETF
 Hong Kong ETF
 Bitcoin Treasuries
 Crypto Reversal
 Ethereum Reserves
 HyperLiquid Wallet Analysis
 Hyperliquid Whale Watch
 Large Transactions
 On-chain Movement
 Bitcoin ROI
 Stablecoin Market Cap
 Options Analysis
 News
 Articles
 Economic Calendar
 Features
 Wallet
 Contract Calculator


 Security
 Collections
 Watchlist
 Following
 BTC
Bitcoin is consolidating around US$85,000, and key support and resistance levels are clear.
According to analysis by Rekt Capital, Bitcoin is currently consolidating between the support level of US$82,500 and the resistance level of US$86,700. As analysts Rekt Capital and Darkfost track key price levels and exchange capital flows, the market landscape becomes increasingly clear.
Currently, BTC is trying to hold on to the support level of US$82,500, while resistance close to US$86,700 limits its upside. At the same time, the decline in the exchange's net inflow to outflow ratio suggests that more bitcoin is leaving the exchange amid the recent price rebound.
Rekt Capital: Focus on key price ranges
Rekt Capital points out that Bitcoin currently hovers between support at around $82,500 and resistance at $86,700. The analyst said that if the support level can be held, BTC is expected to enter the price range of US$86,700 to US$93,700. However, if it falls below $82,500, Bitcoin could fall back into the broader macro range of $60,000 to $80,000. This level is critical given that BTC is struggling to maintain the momentum of its recovery.
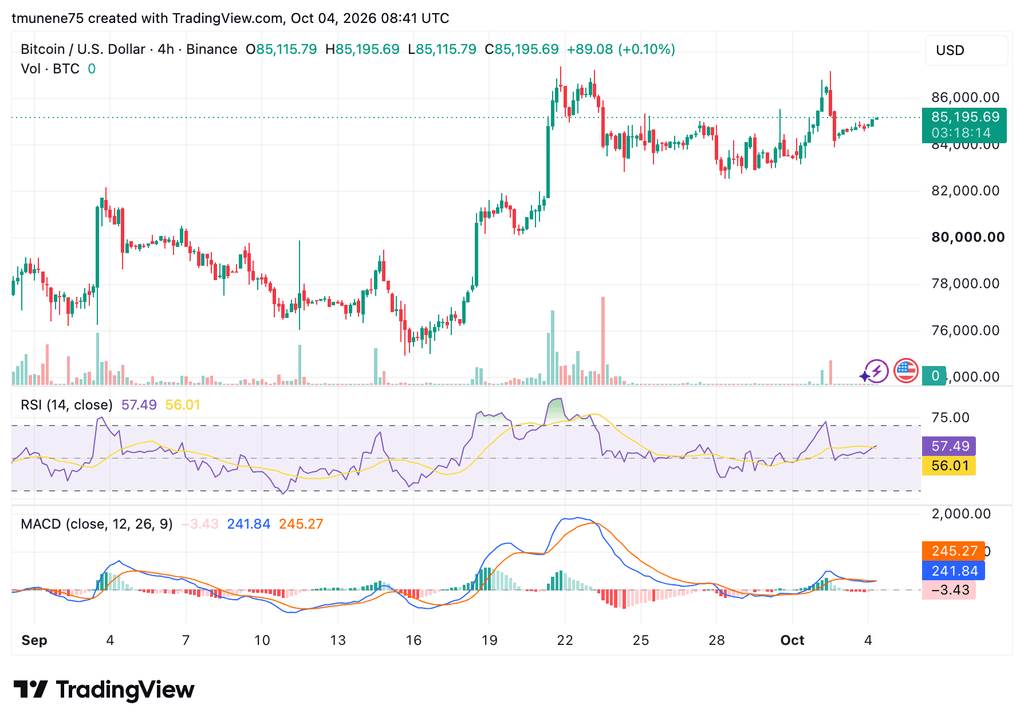
The four-hour chart shows Bitcoin at US$85,195.69, after recovering from the US$75,500 - 76,000 range around September 16. Subsequently, BTC broke through the US$80,000 mark and climbed to the US$86,000 - 87,000 region between September 22 and 23. Since then, Bitcoin has experienced a correction and consolidated between $83,000 and $86,000. The latest price movement puts BTC at the upper edge of the range.
Darkfost: Bitcoin cumulative trend appears
Darkfost reported that the monthly average exchange inflow to outflow ratio of Bitcoin has dropped to approximately 0.97. The analyst pointed out that this trend reflects that outflows have exceeded inflows in the current market stage. According to Darkfost, investors may withdraw BTC from exchanges in order to transfer it into self-custody for long-term storage. This phenomenon comes against the backdrop of Bitcoin's continued rise over the past month.
Source: TradingView
Kinetic indicators show mixed signals
The four-hour chart shows immediate resistance in the US$86,000-US$87,000 range, of which US$87,000 is considered a potential breakthrough. If we can decisively break through this range, it will open the way for higher prices. At the same time, US$84,000 provides near-term support, followed by the US$82,000 - 83,000 region. If it continues to fall below $82,000, the structure of the recovery will be weakened.
Bitcoin's Relative Strength Index (RSI) is 57.49, above its average of 56.01 and its neutral level of 50. However, the MACD reading is still slightly negative at-3.43, and its line is at 241.84, which is lower than the signal line of 245.27.