Exchange Ranking
 Top Exchanges
 24h Volume Ranking
 Popularity Ranking
 Exchange BTC Balance
 Proof of Reserves
 Decentralized Exchanges
 Funding Rate
 Funding Heatmap
 Liquidation Data
 Max Pain
 Long/Short Ratio
 Whale L/S Ratio
 Binance/Okex/Huobi L/S
 Bitfinex Margin L/S
 ETF Tracker
 Solana ETF
 XRP ETF
 Hong Kong ETF
 Bitcoin Treasuries
 Crypto Reversal
 Ethereum Reserves
 HyperLiquid Wallet Analysis
 Hyperliquid Whale Watch
 Large Transactions
 On-chain Movement
 Bitcoin ROI
 Stablecoin Market Cap
 Options Analysis
 News
 Articles
 Economic Calendar
 Features
 Wallet
 Contract Calculator


 Security
 Collections
 Watchlist
 Following
 BTC
Bitcoin fluctuated around $86,000 on Tuesday, and U.S. stocks hit a record high.
On Tuesday, the price of Bitcoin (BTC) continued to hover around the $86,000 mark, while the U.S. stock market hit a new all-time high.
Core Points
- Bitcoin is trying to move towards US$87,000, but the liquidity of sell orders that has accumulated near this key level has brought continued resistance.
- U.S. stocks returned to historical highs, with the S & P 500 rising 0.8% to close at 7,835.
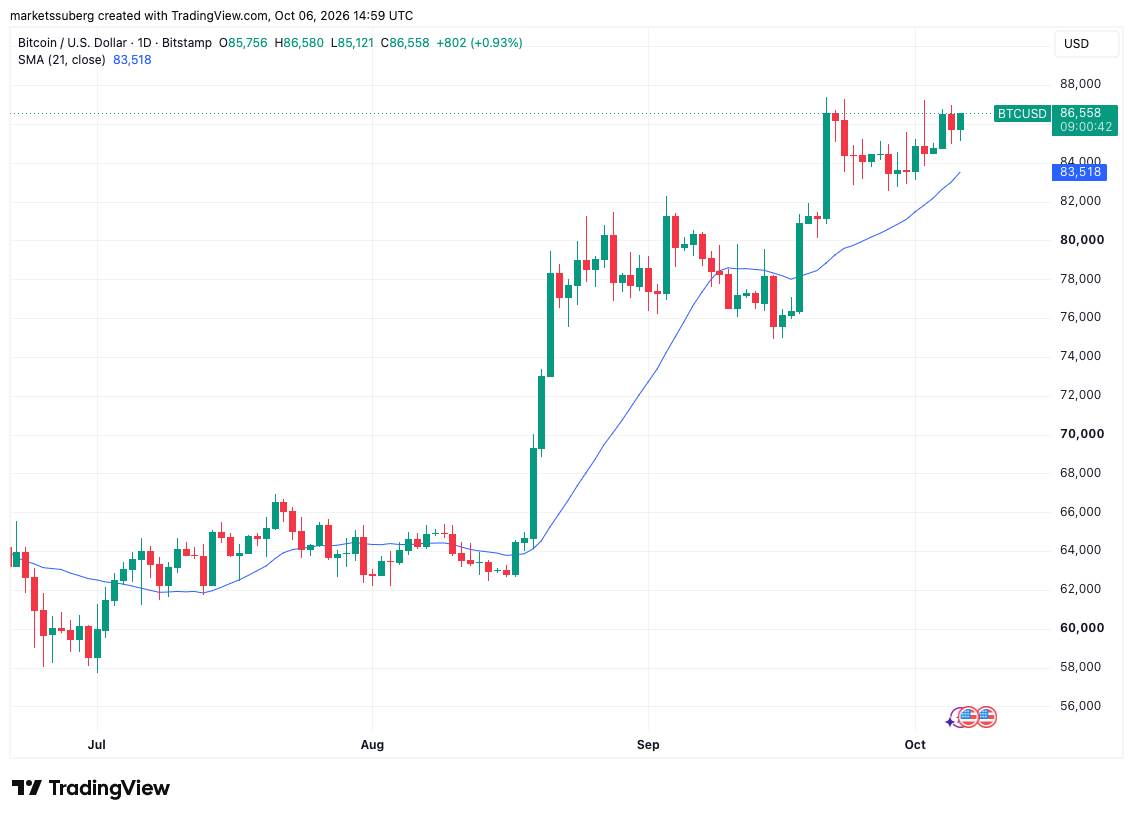
- Judging from the trend of bitcoin prices, the simple moving average (SMA) on the 21st was at US$83,500, constituting a key support level nearby.
The Bitcoin range is consolidating, and the S & P 500 and Nasdaq index hit record highs.
TradingView data shows that BTC/USD is trying to return to the US$87,000 mark after failing to break through again on Monday. 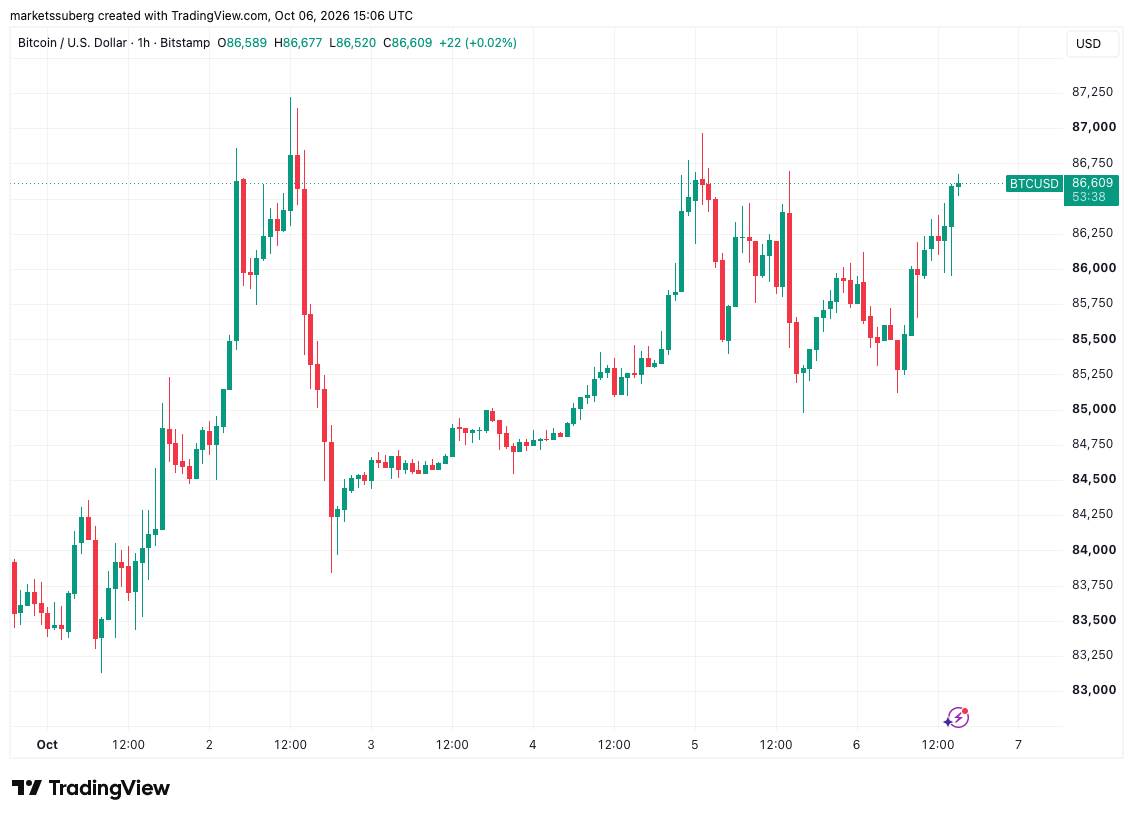
As Wall Street opened, the stock market became the focus. The S & P 500 index, the Nasdaq 100 index and the Nasdaq Composite Index, which account for technology stocks, hit record highs of 7,835 points, 31,312 points and 27,683 points respectively. 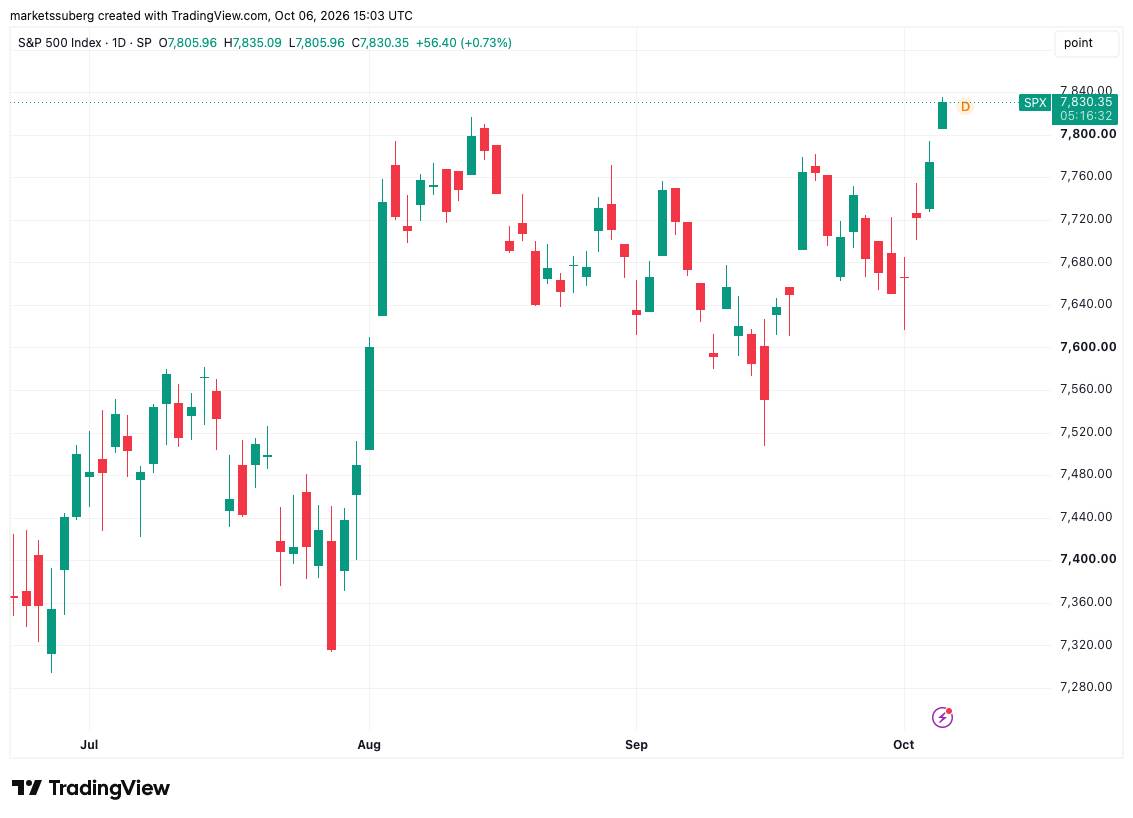
Trading resource "The Kobeissi Letter" commented that since March 30, the market value of the S & P 500 index has increased by 24%, or US$71.3 trillion.
In a new analysis of the stock market outlook, Mosaic Asset Company pointed out that cooling market expectations for the Federal Reserve to raise interest rates in the fourth quarter of 2026 could push the market further higher. "The shift in views around the Fed and the slowdown in the pace of interest rate hikes could be a catalyst for a lasting rebound." The company concluded on Tuesday.
Mosaic reiterated that stock market breadth remains near its lowest level in six months, with only 25% of stocks traded above its 21-day simple moving average (SMA) last week. Technology companies accounted for most of the latest gains. "The stock market breadth has only been so oversold at another point this year, in late March, when the S & P 500 fell into near-correction territory. The oversold situation at the time helped trigger a reversal, and it could happen again in the future." The company commented.
Data from online data analysis platform CryptoQuant shows that there is a moderate positive correlation between Bitcoin and the S & P 500 index. As of October 2, this correlation coefficient was 0.51, the highest value since early June. 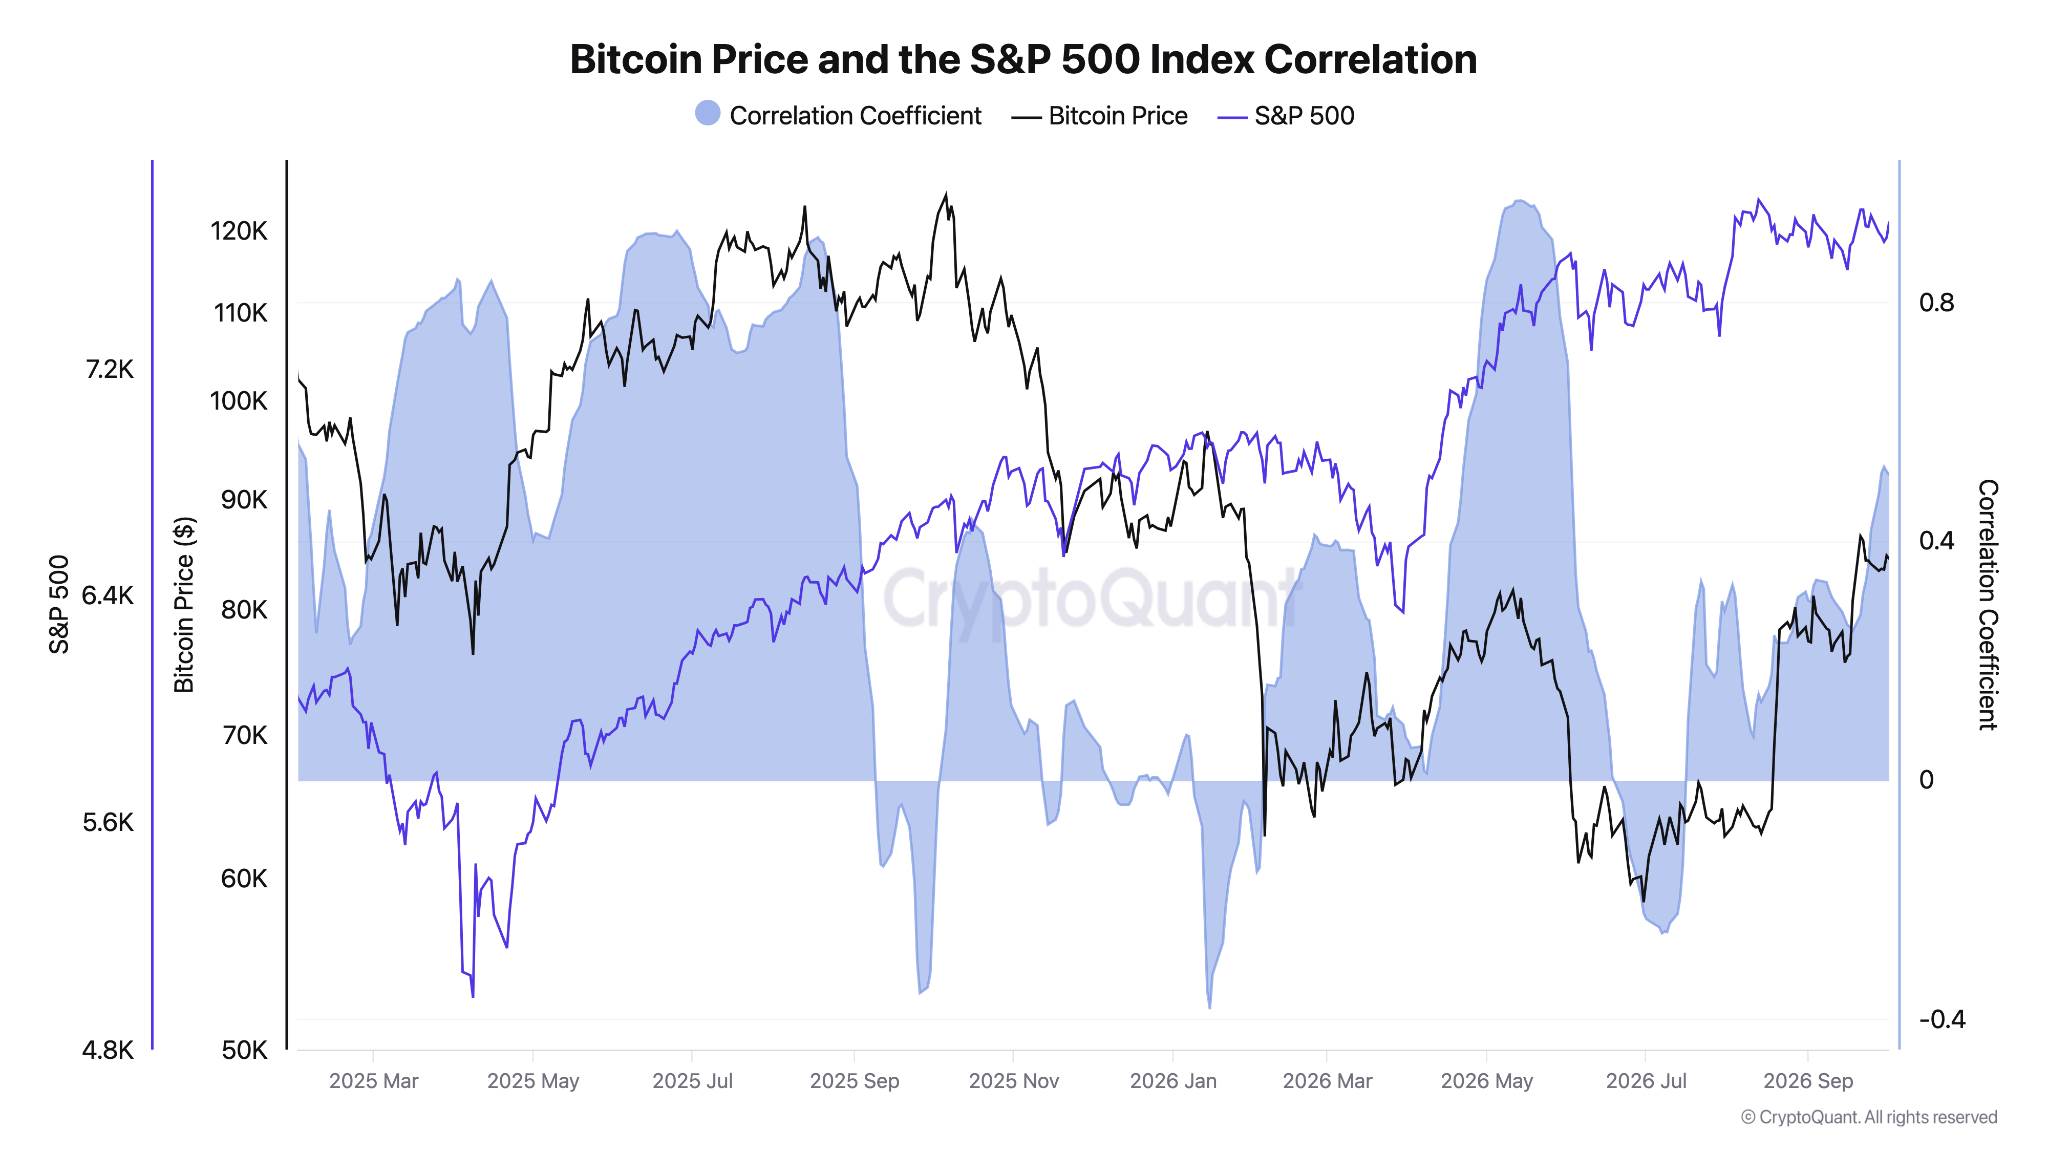
Bitcoin price support depends on the 21st trend line
Bitcoin price action continues to face upward resistance near range highs due to liquidity in sell orders on the exchange order book. Related report: Binance Bitcoin outflows reach the highest level since mid-2023 as whales deposit stablecoins.
CoinGlass data showed that the area with the most concentrated liquidity on Tuesday was around $87,000. A series of "stepped" sell orders extended to $86,500, which likely limited the room for price increases.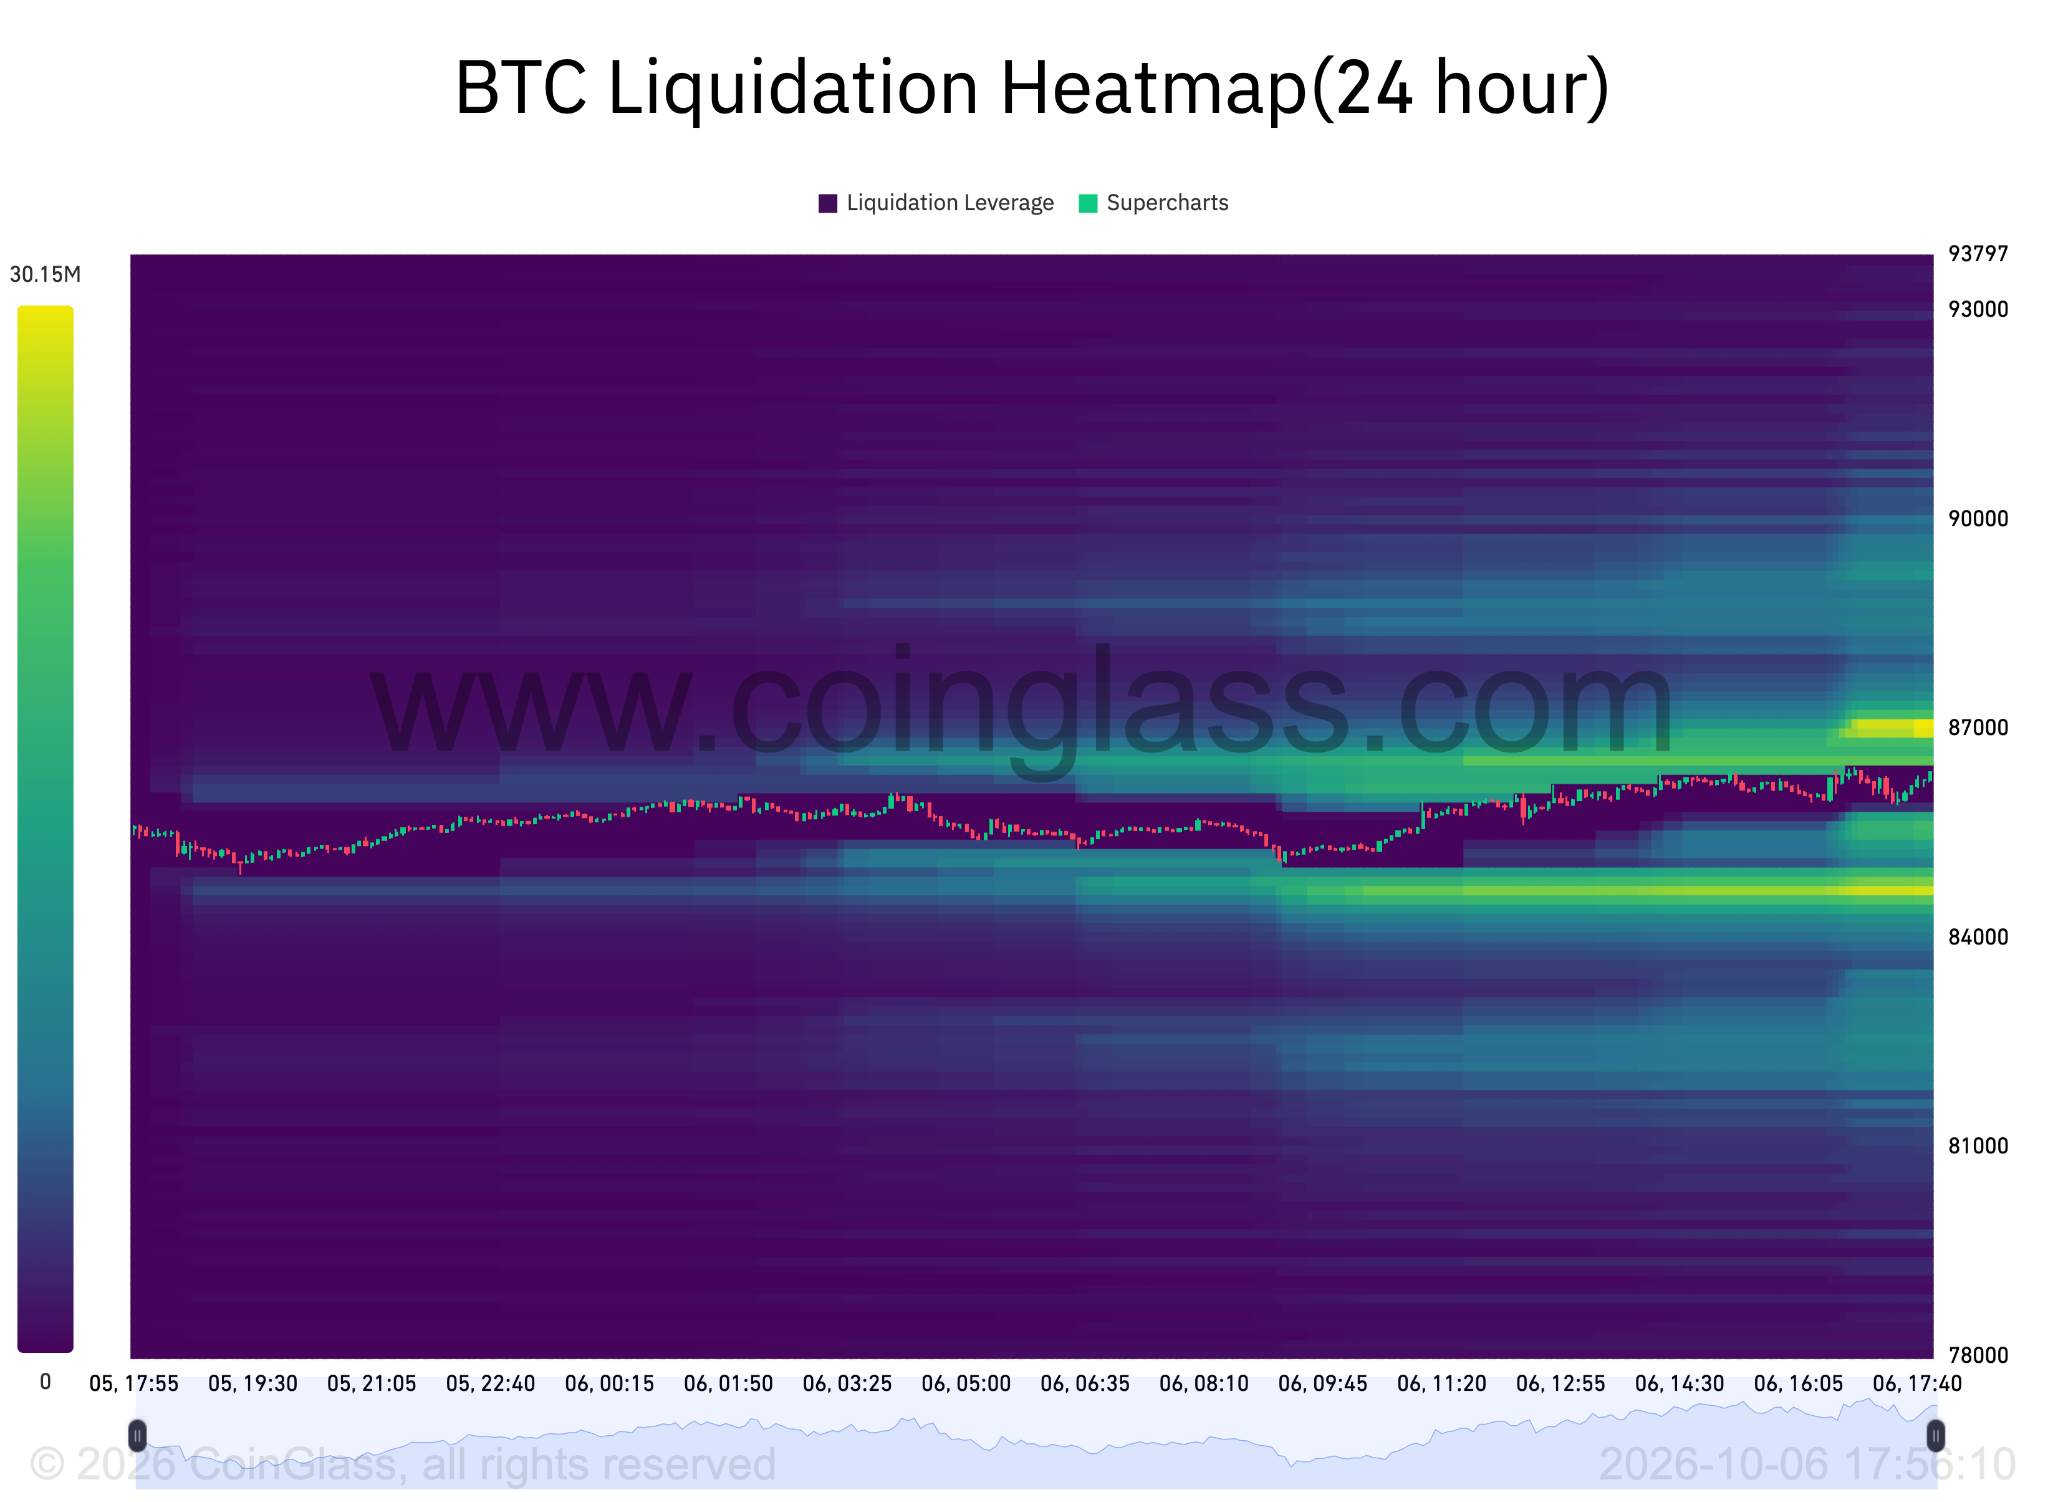
在X平台上发布的最新市场概览中,加密货币交易套件Material Indicators的联合创始人Keith Alan指出,支撑位在83,500美元,即比特币当前的21日SMA。该价位上次交易于9月18日。
Alan在10月1日的分析中写道:“我正在关注83,555美元附近的价位、任何对82,500美元支撑位的测试结构,以及买家能否清除月度信号设定的87,375美元失效阈值。”
“在此基础上,若能收复并成功重新测试87,496美元的年度开盘价,将增强我的观点,即出现超过91,540美元的持久性走势,这将成为确认牛市行情的另一个验证。”