Exchange Ranking
 Top Exchanges
 24h Volume Ranking
 Popularity Ranking
 Exchange BTC Balance
 Proof of Reserves
 Decentralized Exchanges
 Funding Rate
 Funding Heatmap
 Liquidation Data
 Max Pain
 Long/Short Ratio
 Whale L/S Ratio
 Binance/Okex/Huobi L/S
 Bitfinex Margin L/S
 ETF Tracker
 Solana ETF
 XRP ETF
 Hong Kong ETF
 Bitcoin Treasuries
 Crypto Reversal
 Ethereum Reserves
 HyperLiquid Wallet Analysis
 Hyperliquid Whale Watch
 Large Transactions
 On-chain Movement
 Bitcoin ROI
 Stablecoin Market Cap
 Options Analysis
 News
News Articles
 Economic Calendar
 Features
 Wallet
 Contract Calculator


 Security
 Collections
 Watchlist
 Following
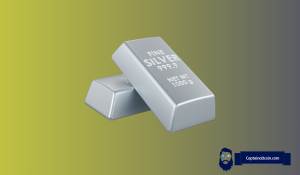
Silver is facing two very different forces
Currently, the silver market is being pulled by two very different forces. Fundamentals show that supply shortages will continue for several years and industrial demand continues to rise; however, judging from the short-term price trend, there is still room for a significant correction in silver. This combination makes the next major trend particularly critical.
Silver has been trapped in a range since August 10. Whether it breaks upwards or downwards, it may determine whether prices move towards higher levels or retest low areas during previous adjustment periods. Analysts Lukas Ekwueme and Winston Wolfe looked at this macro picture from different perspectives. Ekwemet focuses on the persistent silver supply deficit, while Wolf's chart depicts a potentially bullish path, although it may still include several painful pullbacks.
Lucas Ekwamee: Silver supply deficit is colliding with industrial demand
Lucas Ekwamee, who is named @ekwufinance on the X platform, believes that the growing imbalance between silver supply and demand will become increasingly difficult for the market to ignore.
The accompanying charts provide important background information. Between 2016 and 2020, silver recorded annual supply surpluses, although these surpluses varied widely. Things changed in 2021, when demand began to exceed available annual supply.
Silver deficits are accumulating.
We are now in a silver deficit for the sixth consecutive year.
The cumulative deficit has exceeded a year's white silver ore production.
At the same time, industrial demand is surging.
How long can the market ignore these fundamentals?
pic.twitter.com/YNa8TtXuAn - Lukas Ekwueme (@ekwufinance) September 4, 2026
The deficit in 2021 will be approximately 80 million ounces, which will then expand to approximately 250 million ounces in 2022. There will be another shortage of approximately 200 million ounces in 2023. Silver will still be in a deficit in 2024, with a shortage of nearly 150 million ounces. Estimates for 2025 show the deficit will still exceed 100 million ounces.
According to the chart, 2021 to 2025 is the fifth consecutive year of silver supply deficit. However, Ekwemet's accompanying text describes the current situation as "the sixth consecutive year", so its textual expression is different from the period shown in the chart.
Industrial demand forms another important part of his argument. The yellow line in the chart shows that industrial silver demand as a proportion of total supply has climbed from approximately 46% in 2016 to approximately 67% of estimates in 2025.
The following data helps clarify the situation:
- According to the chart provided, silver recorded an annual deficit between 2021 and 2025.
- The deficit in 2022 will reach approximately 250 million ounces.
- The shortage in 2023 remains at around 200 million ounces.
- Estimates for 2025 still show a deficit of more than 100 million ounces.
- Industrial demand has risen to about 67% of total silver supply.
Ekwemet also pointed out that the current cumulative deficit has exceeded a year's white silver ore production. This does not mean that silver prices must rise immediately. Existing inventories can make up for part of the difference between annual production and consumption. If these inventories continue to provide metals that current production cannot replace, continued deficits will become even more important.
Winston Wolf's silver chart shows that a larger rally may take time
Winston Wolf, who goes under the name @MrWWolfe on the X platform, looks at silver prices from a broader technical perspective.
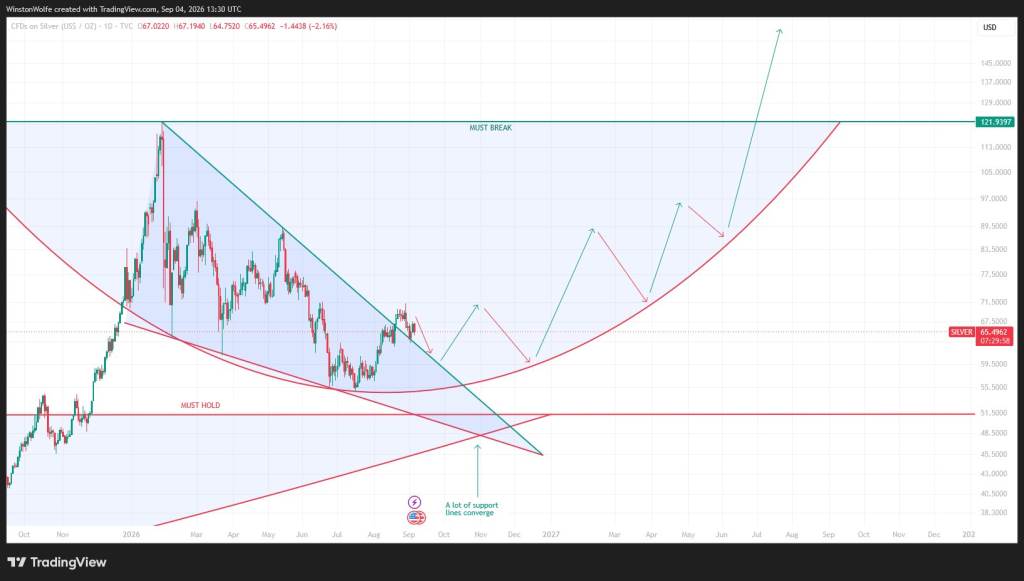
His chart shows that silver has broken through the long-term downtrend line that has suppressed prices since its main high in 2026. Getting rid of this structure has improved broader technical aspects, but Wolf does not expect silver prices to rise straight from then on.
Looking at Wolf's silver chart, you can see a large arc structure that extends into 2027. The path he predicts includes several rises, followed by a sharp correction, before prices may hit the upper boundary. This detail is important because Wolf's bullish view allows for a lot of volatility along the way.
@MrWWolfe / X
The chart identifies approximately $51.50 as an important level that "must be held." Several support lines are also converging in the broader $45 to $52 area, which could make the area critical during a deep correction.
Wolf's upside target is much higher. His chart positions about $121.94 as the main resistance level that silver "must break through."
The expected route to the region is by no means straight. Wolf charted a possible path towards the approximately $70 and later the $89 to $95 area. His scenario also included steps to pull back into the late 1950s, early 1970s, and mid-1980s, and then try further upwards.
As a result, Wolf expects silver prices to fluctuate up and down for a considerable period of time until the larger arc enters the later stage.
His analysis also provides an interesting connection to current silver price forecasts. Wolf identified the low $50 area as an important area within the broader structure, while our shorter-term analysis also independently points to a range of approximately $53 to $50, provided immediate support fails.
Short-term silver price forecasts put US$63 and US$71 at the core of the next move
Short-term silver price forecasts are much more cautious than fundamental supply conditions imply.
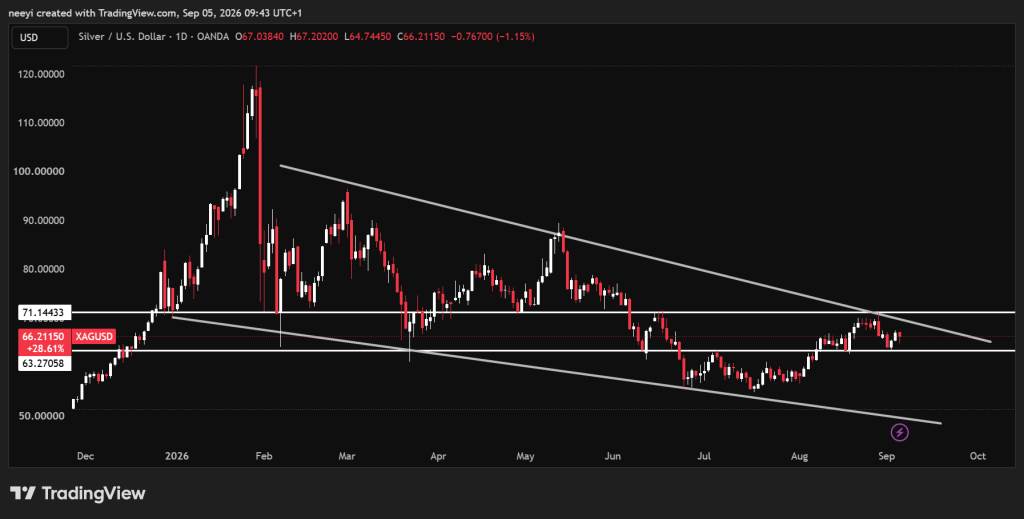
Observation daily charts show that since August 10, silver has been traded mainly within ranges. The bottom of the main border is about $63.3 and the top is $71.
If either party fails to produce a convincing breakthrough, silver may continue to move within that range. However, the current technology structure gives sellers an advantage.
XAGUSD Price Chart/ TradingView.com
Prices have recently rebounded from the top of the downtrend channel pattern. If the channel continues to be respected, it may put pressure on the lower bound of the range in the next few days.
A break below about $63.2 would be the first major bearish signal. After that, silver prices could slip into the $53 to $50 range.
This downfall area deserves special attention, as Wolf's larger cycle chart also confirms support near the $50 low area. If it fails near $50, and if selling pressure remains strong, silver may be exposed to lower positions.
Bullish silver price forecasts require breakthroughs in the opposite direction. Silver needs to break through $71 and establish price behavior outside the current range. Such a breakthrough could open the way to about $77. Continued strength beyond $77 could make $89 an achievable goal in the next few weeks.
Supply crisis and price structure point to different timelines
When fundamental and technical arguments are viewed together, the current pattern of silver becomes clearer. Ekwemay's supply data shows that the market has consumed more silver than its annual supply for several consecutive years. Based on estimates for 2025 shown in its chart, industrial demand has also climbed to about 67% of total supply.
Wolf's analysis provides a possible explanation for how these fundamentals ultimately translate into higher silver prices without creating a straight-line rally. His chart allows silver to make multiple pullbacks before potentially challenging the main $121.94 area.
Immediate silver price forecasts still depend on $63.2 and $71. A break below $63.2 could expose downside of $53 to $50, while a break above $71 could open the path to $77 and ultimately $89.
If the deficit persists, the shortage of silver supply may become increasingly important. The more pressing question is whether silver prices will break upwards through the current range or visit the low $50 area first before the larger story has a chance to unfold again.
FAQs
Why is silver called XAG?
Silver is known as XAG because it is the official ISO 4217 currency code for one ounce of troy silver in the financial market.
Is XAG silver a good investment?
XAG (spot silver) can be used as a tool for portfolio diversification and anti-inflation, but it is highly volatile and currently trades at about $66.90 per ounce.