Exchange Ranking
 Top Exchanges
 24h Volume Ranking
 Popularity Ranking
 Exchange BTC Balance
 Proof of Reserves
 Decentralized Exchanges
 Funding Rate
 Funding Heatmap
 Liquidation Data
 Max Pain
 Long/Short Ratio
 Whale L/S Ratio
 Binance/Okex/Huobi L/S
 Bitfinex Margin L/S
 ETF Tracker
 Solana ETF
 XRP ETF
 Hong Kong ETF
 Bitcoin Treasuries
 Crypto Reversal
 Ethereum Reserves
 HyperLiquid Wallet Analysis
 Hyperliquid Whale Watch
 Large Transactions
 On-chain Movement
 Bitcoin ROI
 Stablecoin Market Cap
 Options Analysis
 News
News Articles
 Economic Calendar
 Features
 Wallet
 Contract Calculator


 Security
 Collections
 Watchlist
 Following
 HYPE
HYPE Hyperliquid price forecast: Bulls momentum is accumulating, and key support testing is imminent.
As $HYPE returns to the previously barely broken level for backtesting, market interest is heating up again. There are some interesting phenomena on the four-hour chart. This backtest trend may move in two directions, but once the direction is clear, it usually reveals who is really in control. Meanwhile, a large wallet is quietly moving in the background, adding a new level to the story, and prices are at this critical decision-making point. The following is the complete market picture.
Hyperliquid Price of the Day: Real-time HYPE data with 24-hour changes
Hyperliquid was trading at $84.021 as of the time of this snapshot, down 2.16% intraday and approximately $1.85 in the last 24 hours. Futures volume on the exchange was as high as $2.73 billion, while spot volume was only $229.22 million, indicating that leveraged trading currently dominates the main driver of HYPE's short-term price volatility. Open Interest reached $3.35 billion, which is a fairly large number and indicates that there is a large number of active positions near the current price. Hyperliquid has a market cap of $21.18 billion and a circulating supply of 251.53 million HYPEs, matching its total and maximum supply of 951.94 million tokens, meaning that all tokens have entered circulation.
Today's Hyperliquid News: Whales have purchased US$9.1 million from Coinbase
The latest Hyperliquid news focuses on a wallet that continues to withdraw HYPE from exchanges. 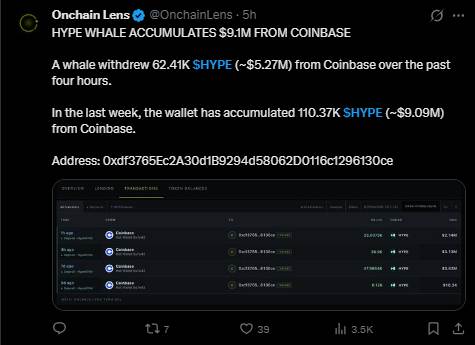 According to online data shared by Onchain Lens, in the past four hours, a whale address withdrew 62.41 million HYPEs from Coinbase, worth nearly $5.27 million. Looking at the time span, in the past week alone, the same wallet labeled 0xdf3765Ec2A30d1B 9294d58062D 0116c1296130ce has accumulated a total of 110,370 HYPEs from Coinbase, worth approximately US$9.09 million. Such large withdrawals from major exchanges rather than deposits are often seen as accumulation of signals rather than attempts to sell, which is the latest development that traders following this backtest need to pay close attention to.
HYPE Technical Forecast: Price Forecast and Breakout Levels
On the four-hour chart, HYPE has been climbing along an uptrend line as a support that has recently played an important role. 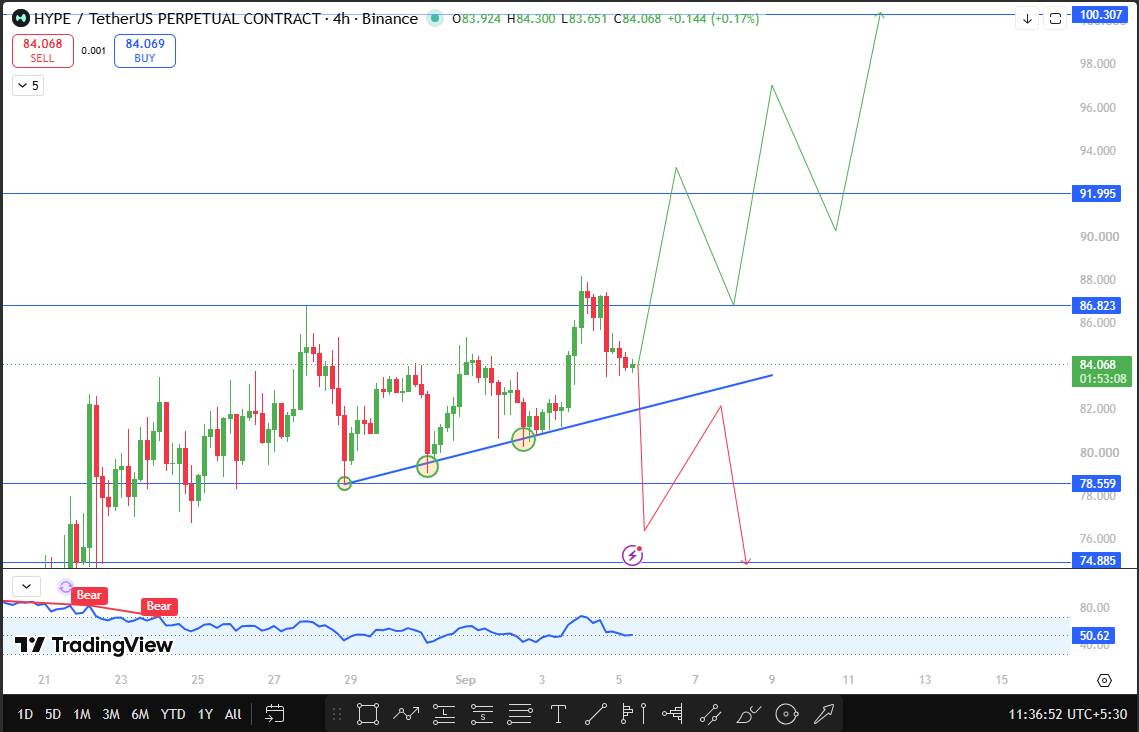 The price broke through the previous band high while still relying on this rising line, confirming that buyers have enough power to clear the space that previously restricted increases. Now HYPE has pulled back and retested the same trend line from above, which is usually a normal part of a healthy breakout process as long as the line remains valid. The close of the next four hours will determine the next direction.
If HYPE gains support from the trend line again and successfully closes above $86.823, this will confirm that the breakthrough is effective and open the door to $91.995, which is approximately 9.4% higher than the current $HYPE price. On top of that,$100.307 becomes the next resistance target, nearly 19.3% higher than HYPE's trading price today, a level that will also mark a return to the psychologically meaningful three-digit range.
The other side of this pattern also requires close attention. If HYPE turns to close below $78.559 (approximately 6.6% below the current price), it will be confirmed that the uptrend line has lapsed and the recent breakthrough has been reversed and failed. In this case, the next support level to watch is at $74.885, about 10.9% below current levels, which is the area where buyers entered during the same uptrend in the previous round. Currently, HYPE is in a critical position in the backtesting of the trend line. The next few four-hour K-line can often answer the questions that the entire pattern has been brewing.
HYPE Support and Resistance
Resistance 2 (Major): US$100.307 (+19.3%)
Resistance level 1: US$91.995 (+9.4%)
Breakthrough trigger level: US$86.823 (+3.3%)
Current Price (CMP): US$84.068
Break Trigger Level: US$78.559 (-6.6%)
Support 1: US$74.885 (-10.9%)
Hyperliquid Call, Benchmark and Bear Scenario Analysis
Bullish scenario: $HYPE held on to the uptrend line in this backtest, pushing the four-hour closing price above US$86.823, and continues to leverage the trend of whale accumulation and its recent structural breakthrough to move towards US$91.995 and even US$100.307.
Benchmark scenario: $HYPE fluctuated around the trend line for several periods, testing US$86.823 once or twice, but failed to form a decisive close in either direction. This is a common pause after a breakthrough in the band high and before the market commits to the next action.
Bear scenario: If sellers force the four-hour close below $78.559, this will completely offset the recent breakthrough. Given that open interest exceeds US$3 billion, such declines are likely to accelerate as leveraged bulls are forced to close down to US$74.885.
Risks to watch out for
Leverage is the main factor here, with open interest at US$3.35 billion, much larger than the size of the spot market, so sharp fluctuations in either direction may occur faster than the trend itself suggests. Although whale withdrawals from exchanges are usually a bullish signal on the chain, there is no guarantee that prices will follow up immediately, and broader crypto market sentiment or Hyperliquid's unique developments may easily override the short-term technical picture. These levels are best viewed as a framework for tracking trends rather than as fixed results.
Key Terms
Uptrend Line: A line drawn along a series of rising lows that serves as dynamic support when prices are trending upward.
Trend line backtest: Prices fall back to levels previously breached, and the market checks whether this level is now effective as new support or resistance.
Open interest: The total number of derivative contracts that have not yet been settled, used as a measure of active leveraged positions.
On-chain accumulation: The pattern of wallets continuing to withdraw assets from exchanges is often interpreted as an intention to hold rather than sell.
Disclaimer
This article is for reference only and does not constitute financial, investment or trading advice. The cryptocurrency market is extremely volatile, and price forecasts are based on technical analysis and may change rapidly as new market data emerge. Before making any investment decisions, be sure to conduct independent research and consult a qualified financial adviser.