Exchange Ranking
 Top Exchanges
 24h Volume Ranking
 Popularity Ranking
 Exchange BTC Balance
 Proof of Reserves
 Decentralized Exchanges
 Funding Rate
 Funding Heatmap
 Liquidation Data
 Max Pain
 Long/Short Ratio
 Whale L/S Ratio
 Binance/Okex/Huobi L/S
 Bitfinex Margin L/S
 ETF Tracker
 Solana ETF
 XRP ETF
 Hong Kong ETF
 Bitcoin Treasuries
 Crypto Reversal
 Ethereum Reserves
 HyperLiquid Wallet Analysis
 Hyperliquid Whale Watch
 Large Transactions
 On-chain Movement
 Bitcoin ROI
 Stablecoin Market Cap
 Options Analysis
 News
 Articles
 Economic Calendar
 Features
 Wallet
 Contract Calculator


 Security
 Collections
 Watchlist
 Following
 XLM
技术面信号减弱,XLM动能正在消退
XLM的上涨动能正在逐渐减弱,RSI指标已发出卖出信号,且价格跌破抛物线SAR(Parabolic SAR)趋势点。衍生品活动活跃,未平仓合约分散在各个交易平台,而近期的清算活动引发了市场波动。
图表显示,若弱势持续,初始下行目标区域为$0.20,随后依次为$0.19、$0.175和$0.16。
在9月反弹之后,XLM显示出动能减弱的早期迹象。RSI走弱以及抛物线SAR指标的转向,构成了近期行情的关键背景。
RSI与抛物线SAR信号暗示动能衰退
MarketSniper Pro在日线图上标记了两个技术变化。文章指出,RSI即将形成卖出信号。同时,价格已运行至趋势点下方。
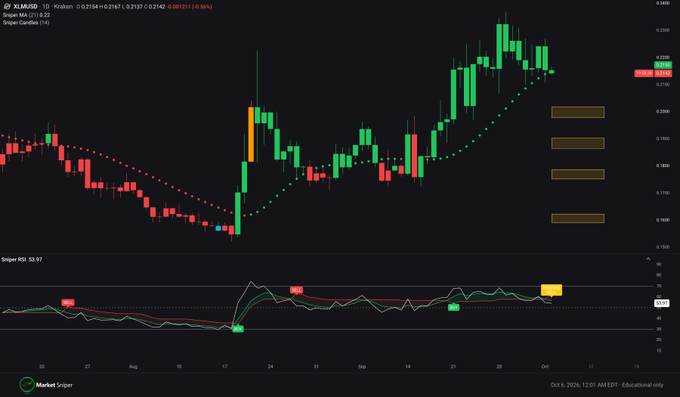
在9月向$0.23区域攀升的过程中,RSI曾大幅走强。此后,动能在高位趋于平缓。这种转变表明,此前的加速上涨势头已开始衰竭。
在最近的价格走势中,抛物线SAR指标也发生了改变。在9月的上涨期间,绿色点一直位于价格下方。最近的变动使该指标再次回到价格上方。
当前市场数据显示,XLM价格接近$0.215。CoinGecko数据显示,24小时交易区间为$0.2110-$0.2257。最新读数确认了9月强势上涨后持续的盘整态势。
反弹结构面临重要价格关口
The broader rally began near a low of $0.15 on May 23. There was a stronger rally around August 18, pushing prices towards the $0.20 area.
The September rebound continued this recovery process, pushing prices above $0.20. The price later reached approximately $0.23. Several rising K-lines support a stronger short-term structure.
However, the latest trend shows that prices have retreated from September highs. Asset prices have returned to near the $0.21 area. This has once again attracted technical attention in the early breakthrough areas.
https://cryptonewsland.com/wp-content/uploads/2026/04/EliteFXLabsBanner-0.webpThe chart marks four downward areas after a broader rebound. The first area is located around $0.20. Other areas appear around $0.19,$0.175 and $0.16 respectively.
Derivatives activity keeps the focus of market volatility
The liquidation chart shows that the largest liquidation events occurred on May 27 and May 28. During this period, both long and short liquidations surged. At the same time, prices fluctuated sharply from about $0.15 to $0.25.
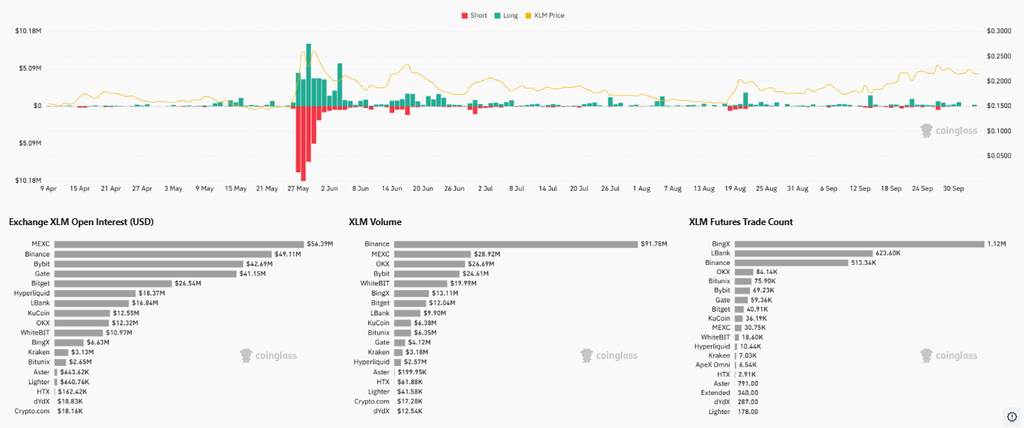
After that major reset, the scale of clearing activities shrank. However, occasional clearing clusters were still observed in June, August and September. Price movements and position adjustments coincide with these periods.
Open interest is still scattered across multiple derivatives platforms. MEXC accounted for the largest proportion of the supply structure, at approximately US$56.39 million. Binance and Bybit followed closely with approximately $49.11 million and $42.69 million respectively.
Trading volume shows another distribution pattern among different platforms. Binance recorded approximately $91.78 million in trading volume. CoinGlass currently reports futures trading volume of approximately $250.68 million and open interest contracts of $297.9 million.
The number of futures transactions data is also different from the trading volume ranking. BingX recorded approximately 1.12 million transactions, while LBank reached 623,600. Binance followed closely with approximately 513,300 transactions.
The composite chart shows that market momentum is cooling after a sustained September rebound. The weakening of the RSI and the turning of the parabolic SAR have strengthened this structural change. At the same time, high derivatives activity has made the market more sensitive to sharp price fluctuations.
The $0.20 area remains the top negative level on the chart. Listed below are the levels of $0.19 and $0.175. If overall weakness persists, the last marked area is around $0.16.