Exchange Ranking
 Top Exchanges
 24h Volume Ranking
 Popularity Ranking
 Exchange BTC Balance
 Proof of Reserves
 Decentralized Exchanges
 Funding Rate
 Funding Heatmap
 Liquidation Data
 Max Pain
 Long/Short Ratio
 Whale L/S Ratio
 Binance/Okex/Huobi L/S
 Bitfinex Margin L/S
 ETF Tracker
 Solana ETF
 XRP ETF
 Hong Kong ETF
 Bitcoin Treasuries
 Crypto Reversal
 Ethereum Reserves
 HyperLiquid Wallet Analysis
 Hyperliquid Whale Watch
 Large Transactions
 On-chain Movement
 Bitcoin ROI
 Stablecoin Market Cap
 Options Analysis
 News
 Articles
 Economic Calendar
 Features
 Wallet
 Contract Calculator


 Security
 Collections
 Watchlist
 Following
 BTC
比特币或正在构建类似2022年熊市底部后的形态
比特币可能正在构建一个令人惊讶地类似于2022年熊市底部之后出现的结构。知名加密货币分析师Mags在X平台上分享的新图表中指出,当前的复苏走势与2022年低点之后的序列存在相似之处。虽然这两个结构并不完全相同,但Mags认为这种相似性已变得难以忽视。
最大的区别在于速度。当前的模式似乎比上一个周期发展得快得多。
Mags观察到相同的比特币基本序列
Mags将旧周期分解为几个阶段。比特币首先在2022年底形成主要底部。随后价格强劲反弹,重新接近之前的颈线位,但在首次尝试时未能突破。BTC在该区域下方花费了额外时间进行整理,最终才突破颈线和长期下降趋势线。这一举动帮助开启了周期的下一个主要阶段。
Mags认为目前正在形成类似的序列。比特币似乎已经形成了潜在的2026年底部,经历了强劲复苏,并重新接近另一个重要的颈线位。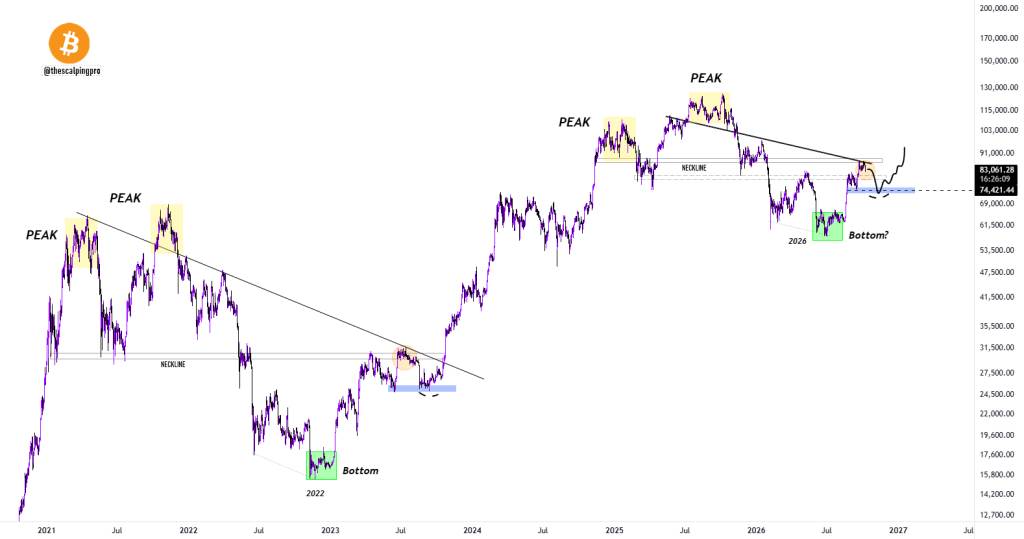 来源:X/@thescalpingpr 问题是,当前的拒绝是否只是价格最终上涨前的又一次暂时挫折。
当前的比特币分形移动速度更快
The most interesting difference is timing. The 2022 structure took longer to form. It took months for Bitcoin to recover from the bottom, test resistance, consolidate, and eventually break through the main trend line. The current version is going through these stages at a faster rate. Mags describes the current sequence as: bottom, recovery, neckline rejection or possible false breakthrough, and then possibly another upward attempt.
This does not mean that Bitcoin will completely replicate the previous cycle. Fractals rarely do this. The value of this comparison is that it provides traders with a framework for identifying what levels of similarity may determine whether or not similarity remains valid.
The neckline is the key level
The most important area in the Mags chart is located in the low-middle area of US$80,000 to US$85,000. Bitcoin is currently trading at close to $83,000 on the chart and remains below the neckline and downtrend line. This creates a clear technical test. If BTC can break through these levels and hold it as support, the current structure will start to look more like a recovery after the bottom of 2022. The chart then left room for further movement into the $90,000 area and beyond. Failure in the same area will trap Bitcoin below resistance and increase the likelihood of another decline.
US$74,000 is still in line with a bullish structure
Mags also identified approximately US$74,000 as an important support area. This is a key part of his argument, because another decline will not automatically destroy the bullish fractal. His chart shows that Bitcoin could fall back to around $74,000, stabilize in the region, and then try another round of recovery. This will be similar to the previous cycle, when Bitcoin also experienced significant rejections before finally breaking its neck line. The key condition is to maintain a broader support structure. If the $74,000 area falls, this comparison will weaken significantly.
Bitcoin Price Outlook
This chart leaves two important levels for Bitcoin. The first is the neckline in the $83,000 to $87,000 area. Continued breakthroughs in the region and downtrend line will strengthen the argument that Bitcoin follows the recovery structure of the previous cycle. The second is support near $74,000. Moving towards $74,000 after being rejected from the current level may still fit Mags 'bullish fractal as long as buyers defend the area. The main risk is assuming historical comparisons ensure that the same results are produced. Market conditions, liquidity and timing vary from cycle to cycle. Still, Mags 'chart provides a useful roadmap.