Exchange Ranking
 Top Exchanges
 24h Volume Ranking
 Popularity Ranking
 Exchange BTC Balance
 Proof of Reserves
 Decentralized Exchanges
 Funding Rate
 Funding Heatmap
 Liquidation Data
 Max Pain
 Long/Short Ratio
 Whale L/S Ratio
 Binance/Okex/Huobi L/S
 Bitfinex Margin L/S
 ETF Tracker
 Solana ETF
 XRP ETF
 Hong Kong ETF
 Bitcoin Treasuries
 Crypto Reversal
 Ethereum Reserves
 HyperLiquid Wallet Analysis
 Hyperliquid Whale Watch
 Large Transactions
 On-chain Movement
 Bitcoin ROI
 Stablecoin Market Cap
 Options Analysis
 News
 Articles
 Economic Calendar
 Features
 Wallet
 Contract Calculator


 Security
 Collections
 Watchlist
 Following
 BTC
 ETH
 SOL
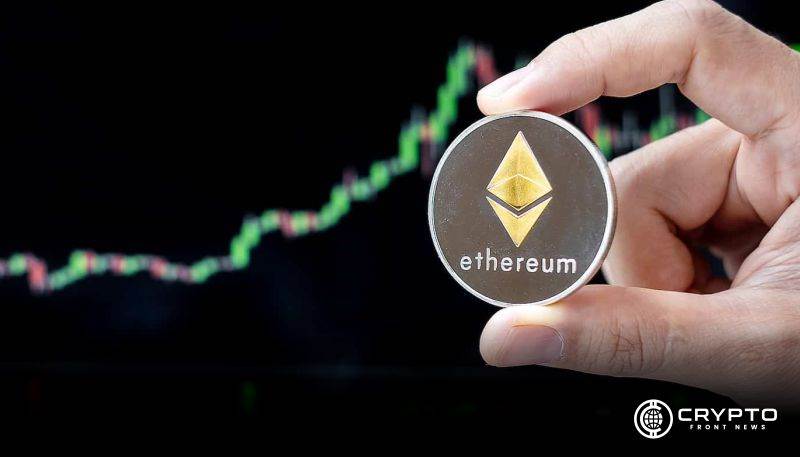
Ethereum traded around $2,500 on October 11 and rebounded after a turbulent week.
On October 11, Ethereum's price fluctuated around $2,500 after a week of violent swings in the asset. The rally comes as Bitcoin approaches $81,000 and Solana hovers around $110, highlighting the continued volatility of the cryptocurrency market.
The key resistance level is concentrated at US$2,600.
Market analyst Petar Jovanović pointed out that the US$2,550 to US$2,600 region is the key resistance range for Ethereum in the short term. If we can successfully break through this area, it will consolidate Ethereum's technical form and lay the foundation for further price increases to US$2,650 or even US$2,700.
In early October, Ethereum once exceeded US$2,700, but then encountered selling pressure and the price fell below US$2,600, reaching as low as US$2,405. The buyer then stepped in and pushed the price back to the psychologically meaningful $2,500 mark.
Despite the rebound, technical indicators are still showing mixed signals. The Relative Strength Index (RSI) improved and the MACD histogram briefly entered positive territory. However, the continued decline in the bar chart suggests that buying momentum may be weakening.
ETF fund flows diverge with institutional sentiment
Institutional sentiment toward major cryptocurrencies appears to be divided. On October 6, the U.S. spot Ethereum ETF recorded a net outflow of approximately US$201.9 million; meanwhile, the Bitcoin ETF reported a net inflow of approximately US$118.8 million during the same period.
This divergence in the flow of ETF funds reflects investors 'more cautious and selective strategies when allocating digital assets. The continued outflow of Ethereum products shows that institutional support for Ethereum remains fragile. Unless direct spot demand improves further, this could limit its ability to continue to rise.
Derivatives Market and Pledge Trends
Ethereum's risk profile is also affected by the development of the derivatives market. During the recent market decline, leveraged positions were cleared to $165 million, reflecting the rapid chain reactions that can occur under volatile market conditions.
On-chain dynamics are still the focus of attention from all parties. More than one-third of Ethereum's circulation supply has been pledged. While pledge activity reduces the amount of ETH available on exchanges, analysts warn that lower exchange balances and pledge rewards do not necessarily lead to higher market prices.
Explanation of terms: MACD histogram
MACD histogram is a technical analysis tool that displays the difference between MACD lines and signal lines and is used to identify changes in market momentum.
Short-term technical indicators for Ethereum are still mixed. The US$2,550 - 2,600 area is considered a key resistance area and continued buying pressure is needed to confirm further upside potential.