Exchange Ranking
 Top Exchanges
 24h Volume Ranking
 Popularity Ranking
 Exchange BTC Balance
 Proof of Reserves
 Decentralized Exchanges
 Funding Rate
 Funding Heatmap
 Liquidation Data
 Max Pain
 Long/Short Ratio
 Whale L/S Ratio
 Binance/Okex/Huobi L/S
 Bitfinex Margin L/S
 ETF Tracker
 Solana ETF
 XRP ETF
 Hong Kong ETF
 Bitcoin Treasuries
 Crypto Reversal
 Ethereum Reserves
 HyperLiquid Wallet Analysis
 Hyperliquid Whale Watch
 Large Transactions
 On-chain Movement
 Bitcoin ROI
 Stablecoin Market Cap
 Options Analysis
 News
 Articles
 Economic Calendar
 Features
 Wallet
 Contract Calculator


 Security
 Collections
 Watchlist
 Following
 BTC
Although Bitcoin’s overall performance in 2025 was below market expectations, the macro environment is beginning to improve in 2026. Chain-level data shows that the selling pressure from long-term holders has reached historical lows, and new selling orders have significantly decreased. At the same time, expectations of inflation decline and policy changes are gradually taking effect, providing room for risk assets to recover. While short-term uncertainties remain, several signs indicate that the most intense downward phase of Bitcoin may be over, and the market is preparing for a new round of stabilization and re-pricing.
Review of 2025
Although Bitcoin achieved a record high in US dollars in 2025, its value was actually at its peak in December 2024, with a subsequent decline of over 50%. This discrepancy explains why many investors still feel emotional distress despite the record-high nominal prices. This year was marked by extreme activity from major investors. The number of long-term holders who actively buy Bitcoin reached historical highs, indicating a large influx of long-term investors into the market.
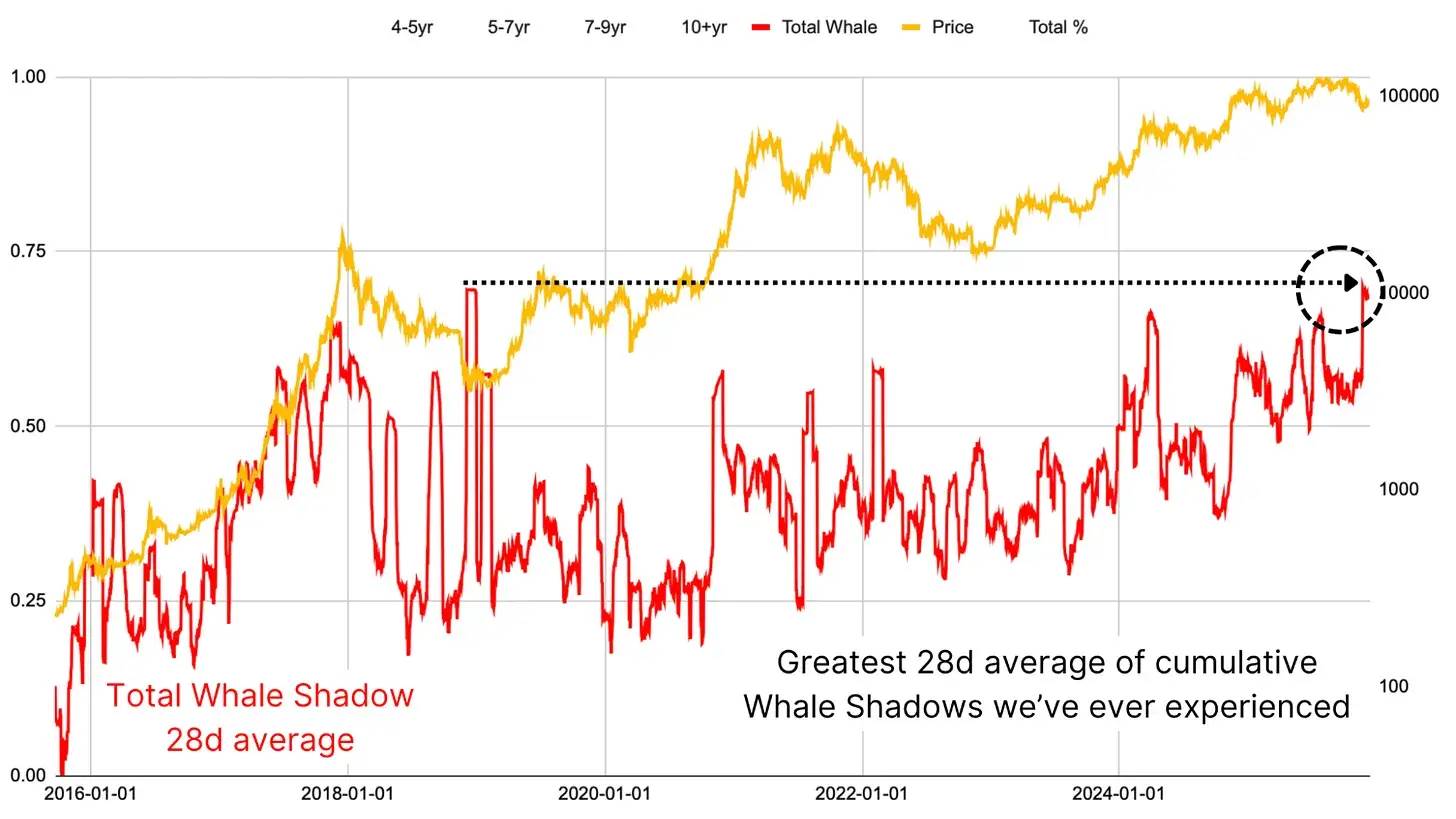
Figure 1: In 2025, a significant number of long-term holders transferred their BTC holdings.
The implication is that long-term holders acquired approximately 7 million to 8 million bitcoins during the year 2025. In contrast, the total amount of bitcoins inflowed into corporate financial funds and ETFs was only about 2 million. This means that 75% of these tokens represent a significant positive trend: this distribution of holdings indicates a shift from “early adopters who purchased at high prices” to “long-term holders who have been holding their positions for a while”. Such holders are more resilient to rapid price declines or panic selling.
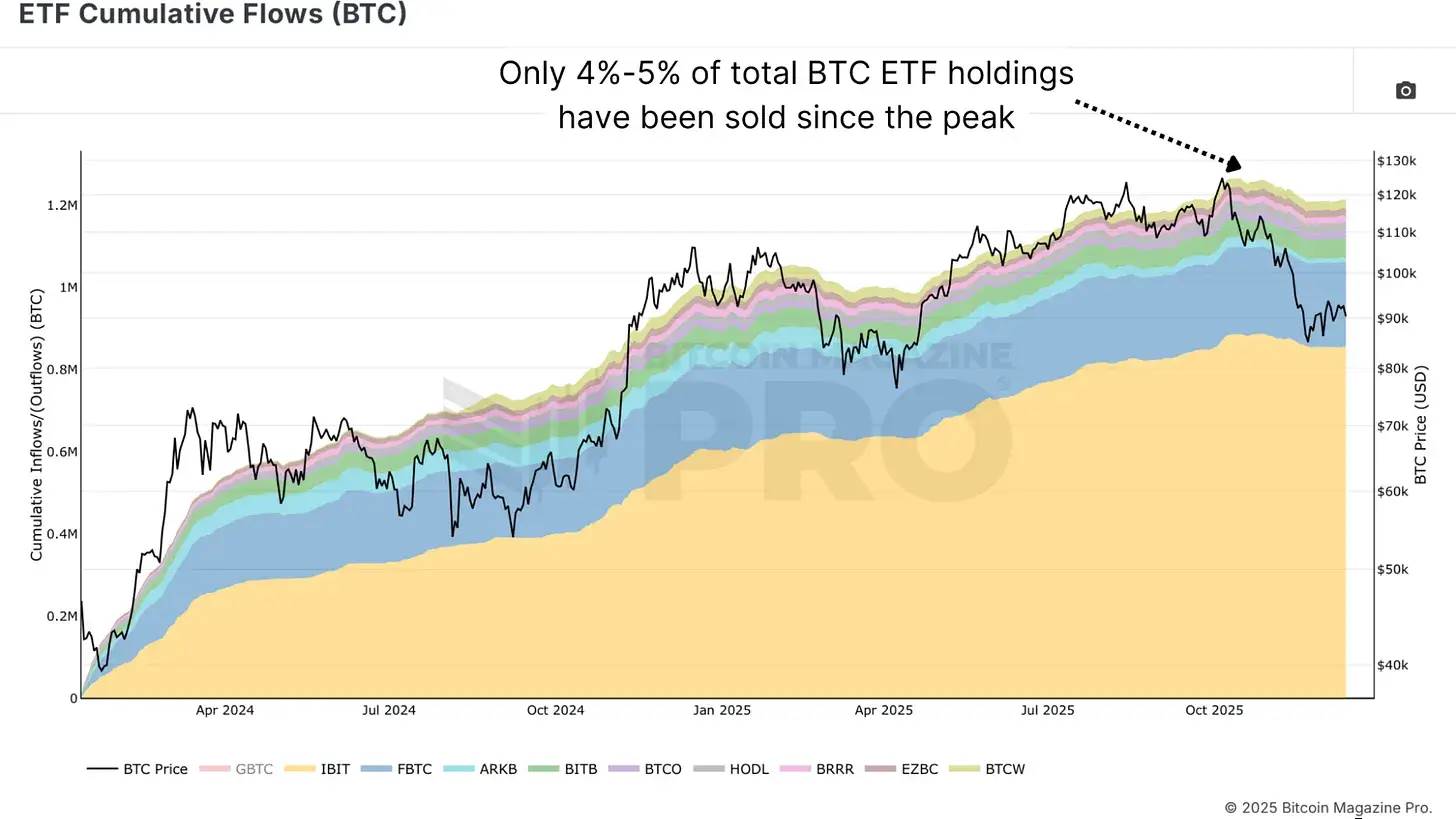
Figure 2: Since the beginning of this cycle, the amount of bitcoins held in ETFs has decreased by less than 5%.
This extreme level of long-term holder selling, combined with the psychological factors surrounding bitcoin prices, as well as the fact that only 4-5% of ETF holdings were sold during periods of high liquidity, suggests that the underlying demand structure remains strong. In any bull market, a decline of 35% from historical highs would be considered a normal correction during the market’s uptrend.
Macroeconomic indicators
The target federal fund rate has continued to decrease, as there is ongoing expectation of further rate cuts by the Federal Reserve. The 2-year U.S. Treasury bond yield is indeed lower than expected, and there is speculation that Federal Reserve Chairman Powell might be replaced by someone more aggressive and more supportive of cryptocurrencies. This represents a major policy change. Quantitative tightening ended on December 1, 2025, marking the third time in Bitcoin’s history that quantitative tightening was halted. The first two times occurred in 2010, 2012, and 2019, respectively. During those times, Bitcoin prices increased significantly in both cases (although there was a significant drop before the sharp rise in 2019 due to COVID-19).
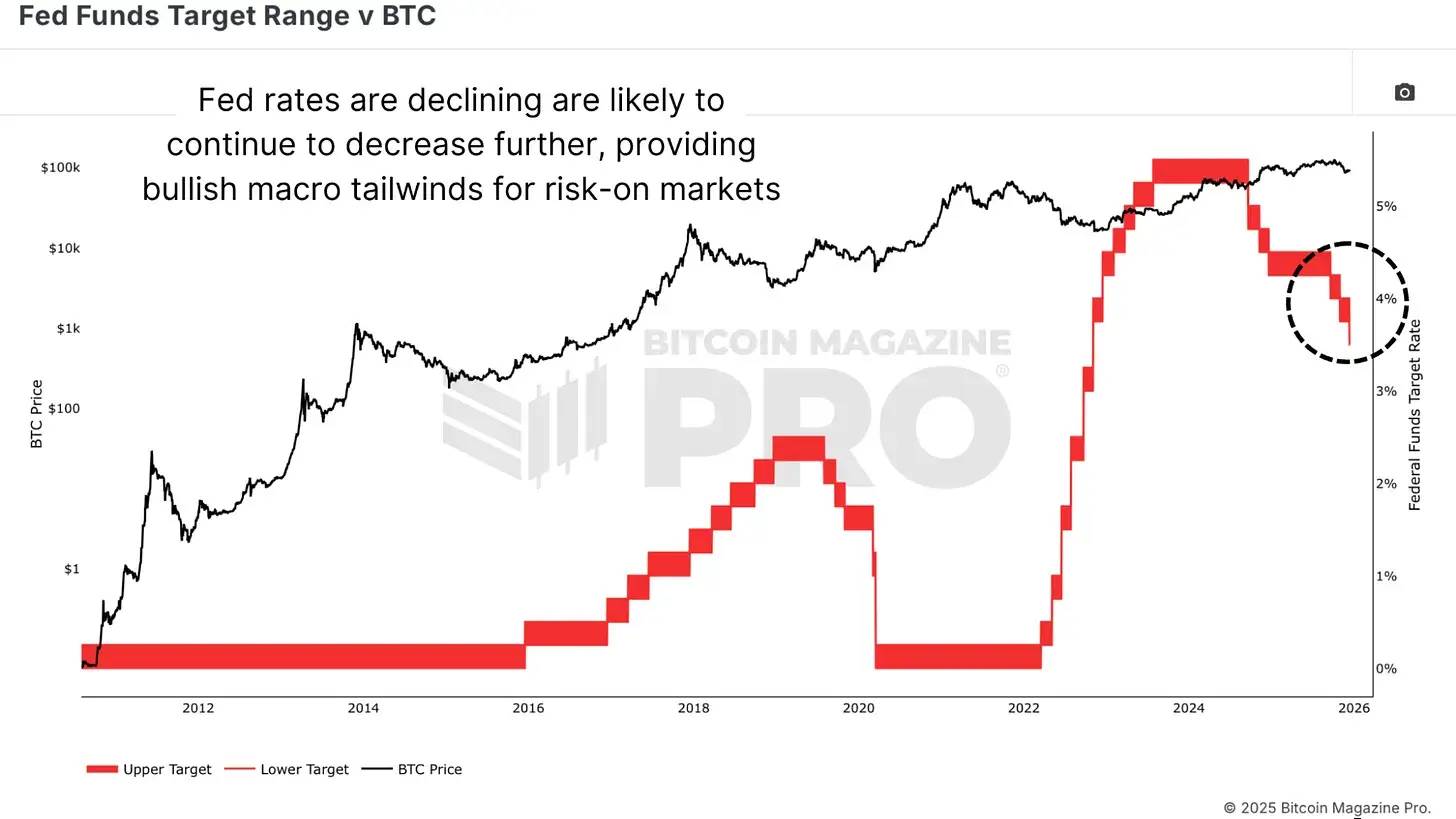
Figure 3: A decline in the federal funds target rate may trigger renewed demand for risk assets.
Global liquidity indicators
The global M2 money supply, calculated with a 100-day lag, has historically provided nearly perfect predictions of Bitcoin prices. After reaching its peak near the edge of the Bitcoin market cycle in October 2025, this indicator is now starting to recover, suggesting a possible bottom could emerge in early 2026.
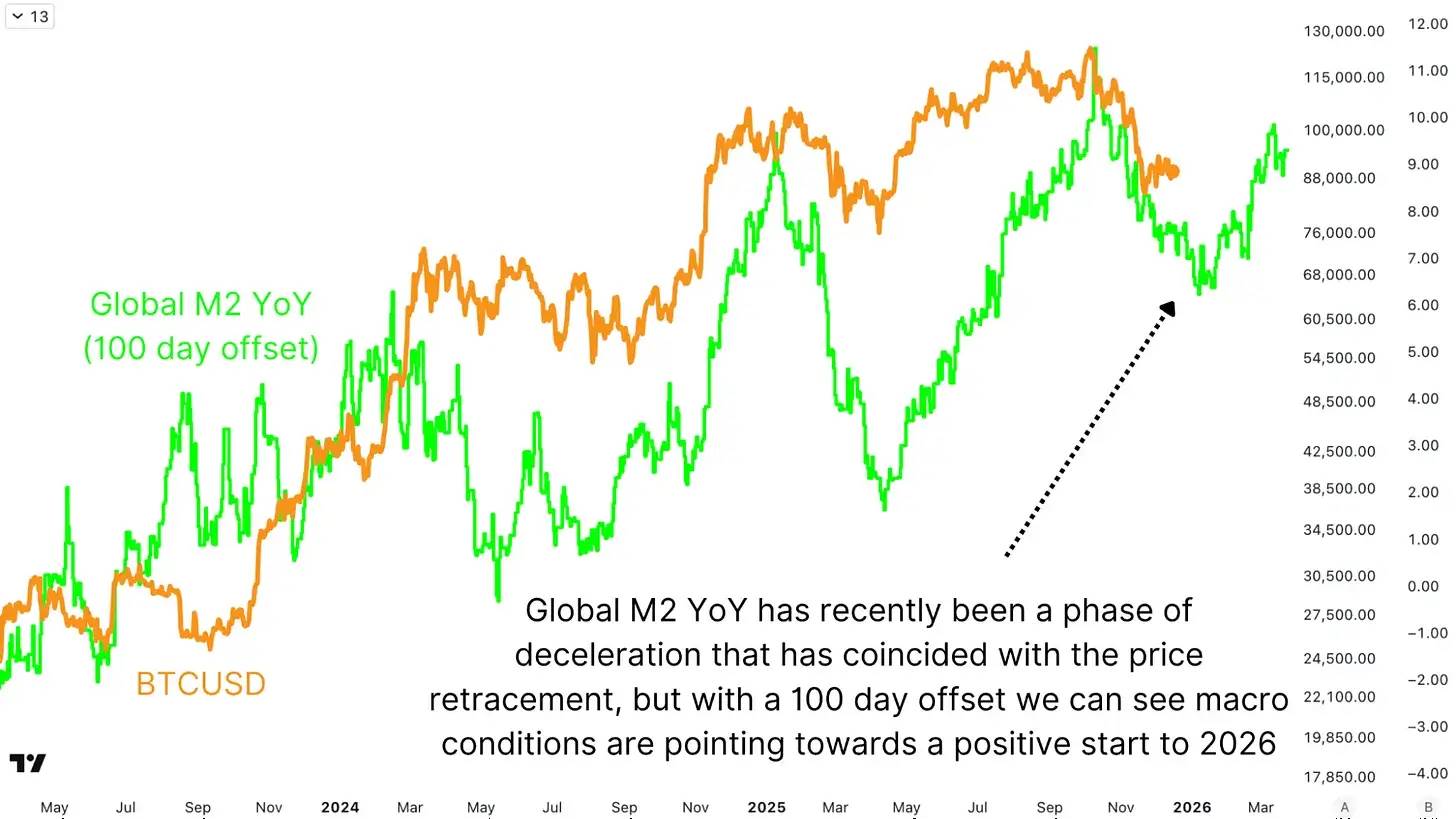
Figure 4: The correlation between the adjusted global M2 money supply and Bitcoin market share indicates that Bitcoin’s market share will begin to recover by early 2026.
Probability-weighted scenario forecast for 2026
A clear main scenario emerges in 2026:
1. Bearish scenario (25% probability): Further declines could push Bitcoin to a level of 15.44 Fano units, corresponding to an current valuation of approximately $66,000. If gold also declines, prices might further drop to $60,000 or lower. This scenario could lead to severe risk aversion, potential related events, or major unexpected developments.
2. Baseline scenario (50% probability): Before stabilizing or recovering at the end of 2025 or early 2026, Bitcoin prices may further drop to $70,000–75,000 in the short term. Additionally, Bitcoin could rebound towards the 100,000 USD threshold and the 365-day moving average. It could even reach the peak of the bull market in 2021, when Bitcoin was valued at around $100,000. This scenario reflects a “moderate bear market” that aligns with the “calm bull market” in the UAE. By the end of 2026, prices are expected to rise slightly.
3. Bullish scenario (25% probability): 比特币加速冲向52.55盎司黄金的目标位,以美元计价可能达到200,000美元以上(若金价上涨则更高)。这需要显着的流动性注入以及资金从其他风险资产转向比特币。
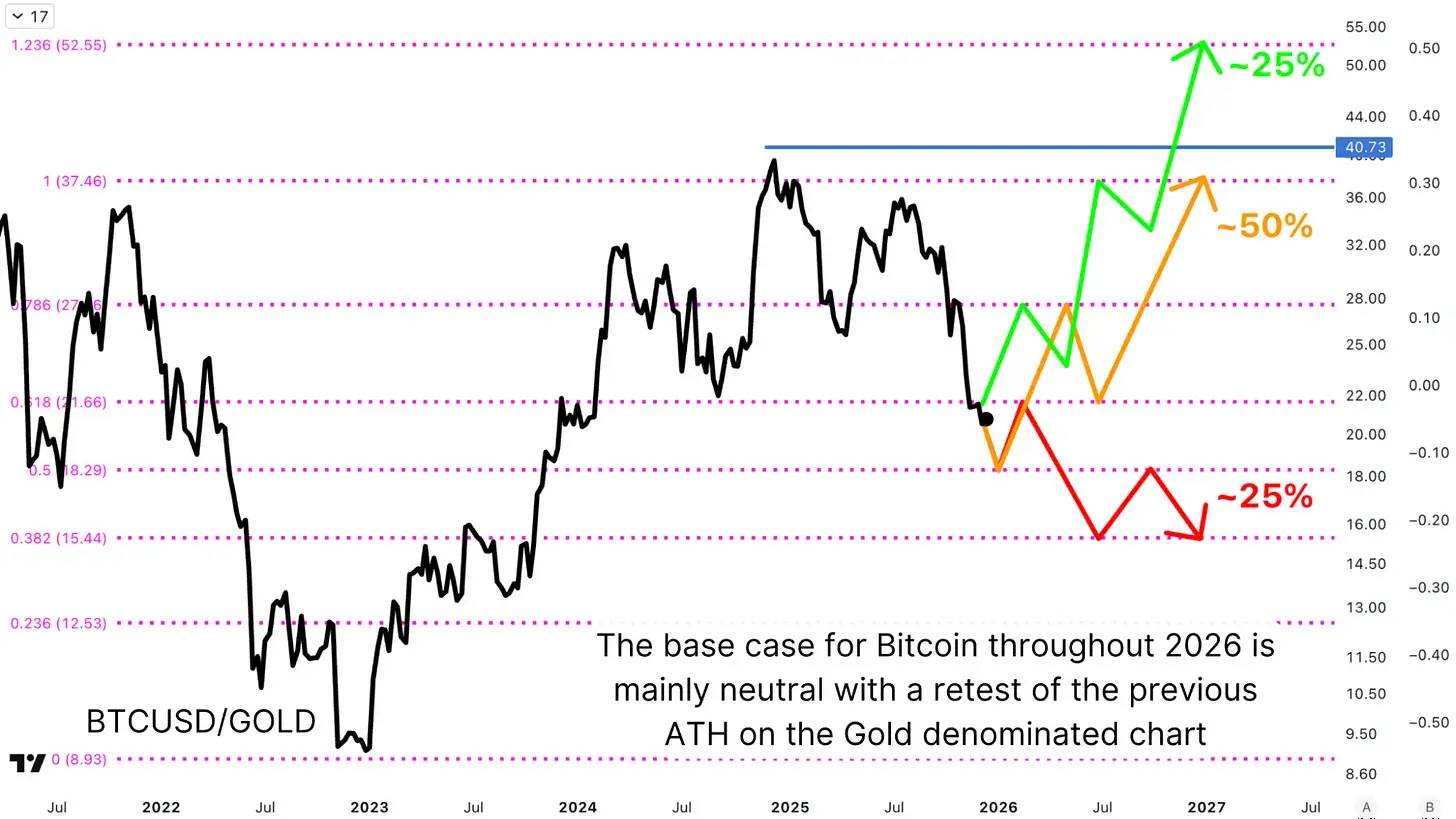
图5:使用明显概率加权情况预测2026年BTC价格走势。
结论
比特币在2025年表现平平(尽管美元新高),应定位长期趋势中动。700万至800万比特币从早期投资者向更坚定的近期投资者大规模转移,结合历史性的巨鲸和长期持有者投降,代表了比特币市场的结构性成熟。机构投资者、企业财务库和ETF的认可,表明比特币正从极端周期转向更正常化的价格波动转型。
尽管2026年本质上仍具不确定性,但目前数据表明比特币最糟糕的价格行动可能已经成为过去。包括潜在降息、QT结束和货币贬值压力的宏观经济利好,创造了结构性有利条件。长期持有者的历史性投降、散户对融资码的吸收以及ETF的坚定信念,都表演市场已经消化了大幅下跌的预期。