Exchange Ranking
 Top Exchanges
 24h Volume Ranking
 Popularity Ranking
 Exchange BTC Balance
 Proof of Reserves
 Decentralized Exchanges
 Funding Rate
 Funding Heatmap
 Liquidation Data
 Max Pain
 Long/Short Ratio
 Whale L/S Ratio
 Binance/Okex/Huobi L/S
 Bitfinex Margin L/S
 ETF Tracker
 Solana ETF
 XRP ETF
 Hong Kong ETF
 Bitcoin Treasuries
 Crypto Reversal
 Ethereum Reserves
 HyperLiquid Wallet Analysis
 Hyperliquid Whale Watch
 Large Transactions
 On-chain Movement
 Bitcoin ROI
 Stablecoin Market Cap
 Options Analysis
 News
 Articles
 Economic Calendar
 Features
 Wallet
 Contract Calculator


 Security
 Collections
 Watchlist
 Following
 SOL
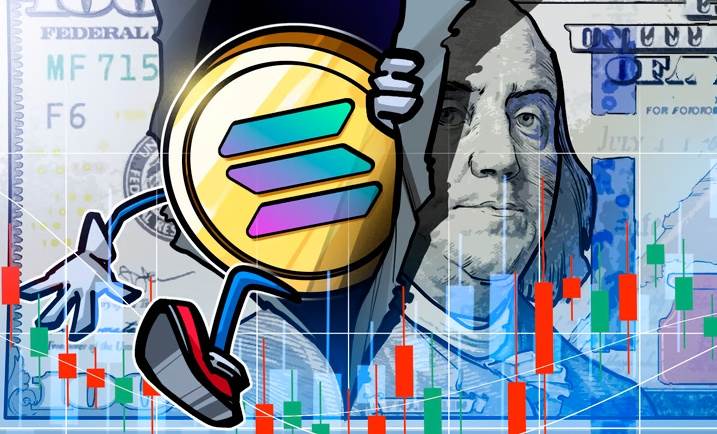
Although SOL has recently reclaimed the $200 mark, a closer look reveals that activity on the Solana network is actually declining. Additionally, SOL faces pressure from strong competitors such as the BNB Chain and Hyperliquid. So the question arises: Is there a chance for SOL to break through the $300 mark by the end of this year? Today, we will discuss this hot topic, analyze the market dynamics and potential opportunities behind it, so you can gain a clearer understanding of the future prospects of Solana.
Key points:
● SOL has recovered above $200, but weak activity on the network and increasing competition limit its ability to sustain a rebound.
● Traders show less bearish sentiment, but stagnant network growth and shifts in market share restrict SOL’s upside potential.
Solana’s native token, SOL, rose back above $200 on Tuesday, recovering from the low of $167 caused by the crash on Friday. The record-breaking $173 million net short position had a significant impact on the SOL derivatives market. This has led traders to question whether short-term momentum has worn off, and whether SOL could potentially reach $300 within this cycle.
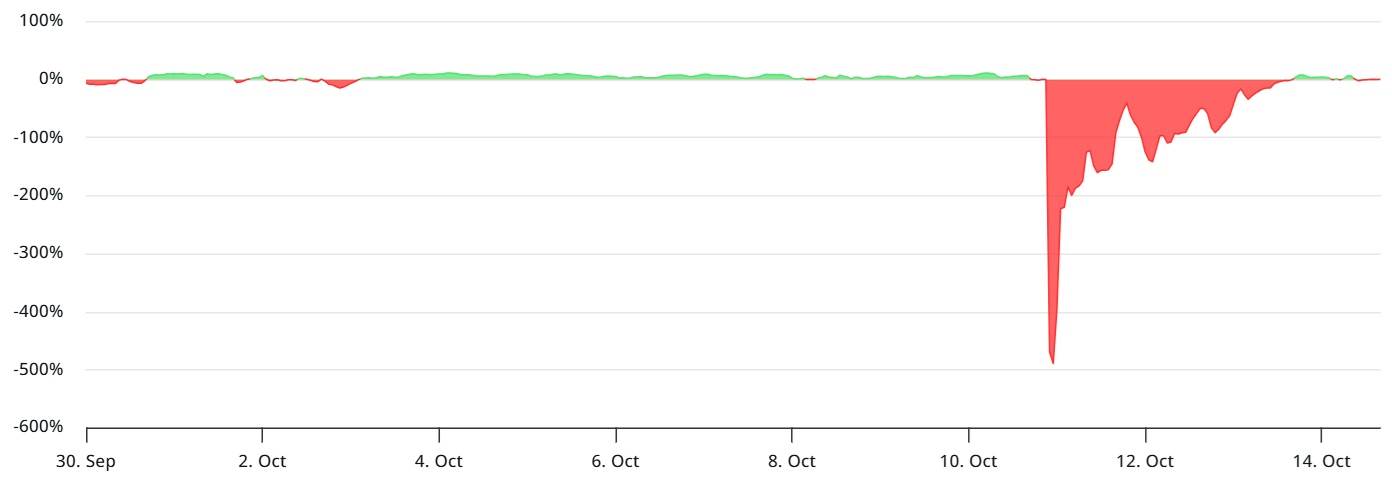
The annualized funding rate for SOL futures stands at [X]. Source: Laevitas.ch
The demand for long positions with leverage remains low, as the funding rate for futures remains around 0%. Under normal market conditions, this indicator typically ranges between 6% and 12%, indicating that buyers are willing to pay to maintain their positions. It’s worth noting that SOL’s funding rate before the crash on Friday was around 4%, which is below the neutral range.
When the funding rate becomes negative, it typically indicates that buyers (sellers) are in control. However, this situation rarely lasts long, due to the high costs associated with maintaining such positions. Nevertheless, the ongoing pressure in the SOL derivatives market may reflect the broader damage caused by Friday’s liquidations in the entire cryptocurrency industry.
Activity on the Solana network has been sluggish due to increased competition.
Indicators on the Solana chain show that although the price of SOL is still 31% lower than its historical high of $295 reached in January this year, there is still a lack of bullish momentum in the market. Since the meme coin boom in 2025, network activity has failed to recover. With new competitors capturing market share, Solana’s leading position in the decentralized exchange sector is also being challenged.
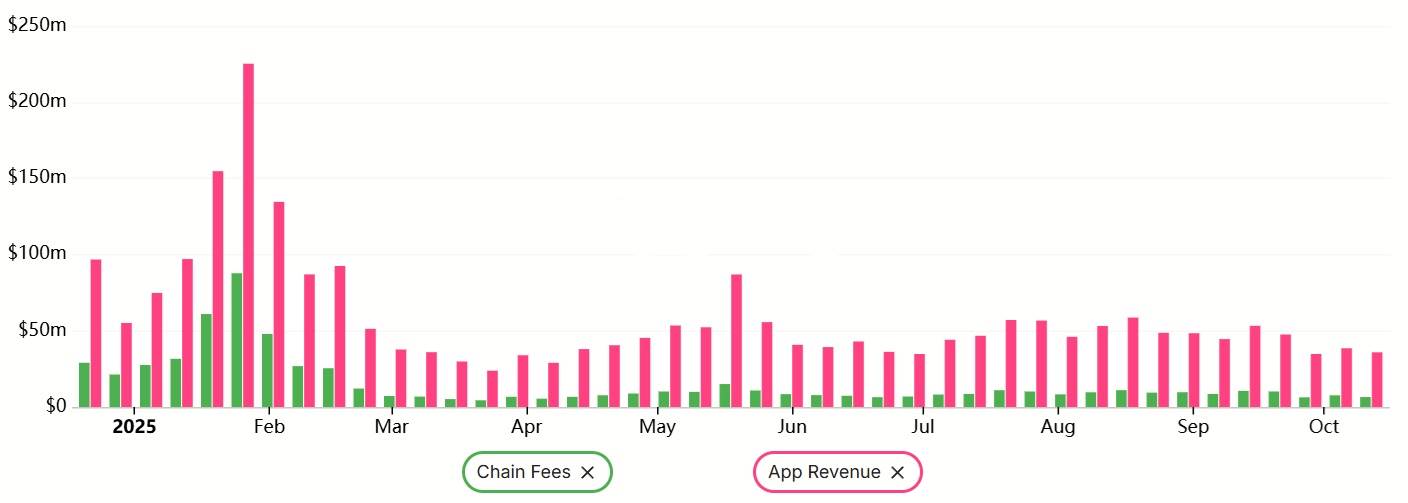
Solana’s weekly network fees and DApp revenues, in US dollars. Source: DefiLlama.
Decentralized applications on Solana generate $35.9 million in revenue each week, while network fees total $6.5 million, a 35% decrease from last month. This slowdown reduces the demand for SOL as a blockchain-based payment token. Reduced activity also lowers the yields for holders of SOL, further increasing downward pressure.
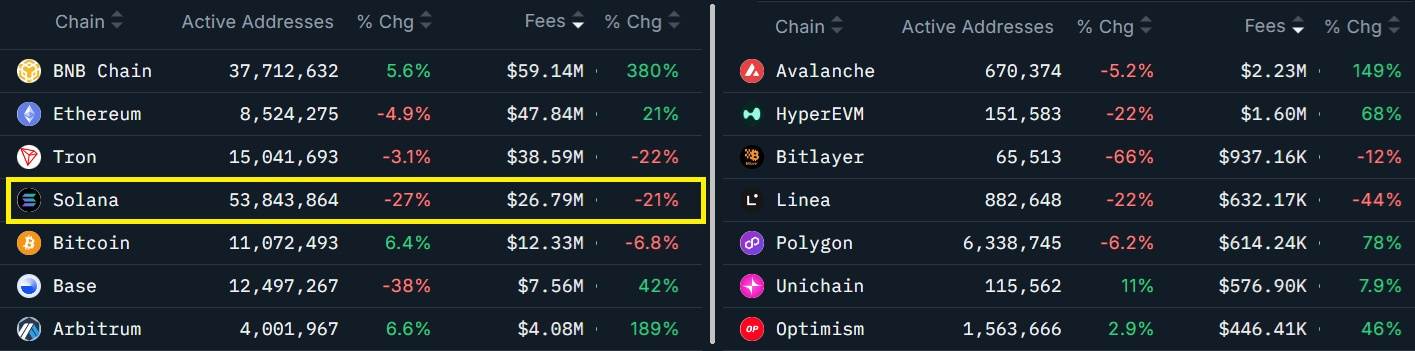
Blockchains ranked by 7-day fees, in US dollars. Source: Nansen.
In comparison, the transaction fees on competing networks such as BNB Chain, Ethereum, and Hyperliquid have increased significantly. This increase is largely due to the loss of market share for Solana. The weekly transaction fee for BNB Chain reached $59.1 million, highlighting the success of the four.meme platform, which integrates closely with Binance wallets. This platform is seen as a direct competitor to Solana’s Pump.fun service. Even if BNB Chain’s strong performance is temporary, the transaction fees in the Ethereum ecosystem have also risen sharply. Layer 2 extension networks like Base, Arbitrum, and Polygon have seen transaction fees increase by more than 40% each week. Uniswap’s transaction fees this week reached a record high of $83.8 million, mainly driven by active transactions on Ethereum and the Base chain. Additionally, Hyperliquid benefited from market fluctuations on Friday, resulting in a significant increase in transaction fees.
By analyzing the ratio of call options to put options, it’s possible to determine whether SOL traders are shifting towards bearish positions.
The ratio of put options to call options on Deribit for SOL shows that demand for neutral or bearish positions has been weak over the past week. Historically, when traders expect price corrections, this ratio tends to rise above 180%—this was the last time it reached this level after SOL prices increased by 26.7% in just 11 days on September 20th.
Although the derivatives indicators of SOL may be distorted due to the fluctuations caused by the crash on Friday, the continued weakness in blockchain-related activities is concerning. The rise of platforms like Aster, Hyperliquid, and Uniswap has significantly boosted Solana’s potential for growth.
Even if traders do not explicitly bear a negative outlook on SOL, a single event—such as the possibility of US regulatory approval for spot Solana exchange-traded funds—is unlikely to be enough to push its price above $300 in the short term.