Exchange Ranking
 Top Exchanges
 24h Volume Ranking
 Popularity Ranking
 Exchange BTC Balance
 Proof of Reserves
 Decentralized Exchanges
 Funding Rate
 Funding Heatmap
 Liquidation Data
 Max Pain
 Long/Short Ratio
 Whale L/S Ratio
 Binance/Okex/Huobi L/S
 Bitfinex Margin L/S
 ETF Tracker
 Solana ETF
 XRP ETF
 Hong Kong ETF
 Bitcoin Treasuries
 Crypto Reversal
 Ethereum Reserves
 HyperLiquid Wallet Analysis
 Hyperliquid Whale Watch
 Large Transactions
 On-chain Movement
 Bitcoin ROI
 Stablecoin Market Cap
 Options Analysis
 News
 Articles
 Economic Calendar
 Features
 Wallet
 Contract Calculator


 Security
 Collections
 Watchlist
 Following
 BTC
比特币近一周的短线表现明显转弱,而资金费率的变化正反映了这一点。虽然整体费率仍保持小幅正值,看似多头还在主导,但从不同时间周期来看,趋势都在放缓,市场的看涨动力正在减弱。值得注意的是,这并不代表行情一定要转熊,而是多头的力量没有之前强。要判断这种疲软是短暂修正还是更深层变化,还需要继续关注另一个关键指标——未平仓合约量,以便判断市场情绪是否正在发生结构性转变。

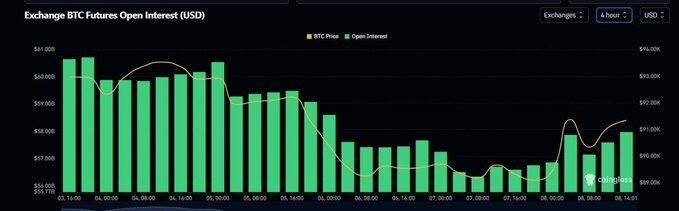
未平仓合约显示市场缺乏方向
未平仓合约量 (OI) 直接反映了市场中仍有多少资金处于活跃状态,无论是多头头寸还是空头头寸。近期图表显示,随着多空双方逐步平仓,未平仓合约量呈下降趋势。在最近一次下跌之后,仓位仅出现轻微补充,远未达到发出新的方向性押注信号。
这种模式类似于一个市场,它既没有足够的信心追逐上涨,也同样不确定是否要承担新的下跌风险。当双方的行动没有明显的区别时,几乎不可能分辨出谁在主导市场。
这种犹豫不决正是开放式投资所反映的:市场在等待催化剂,不愿做出承诺,目前选择降低风险而不是承担风险。
ETF 资金流动未能提供支撑
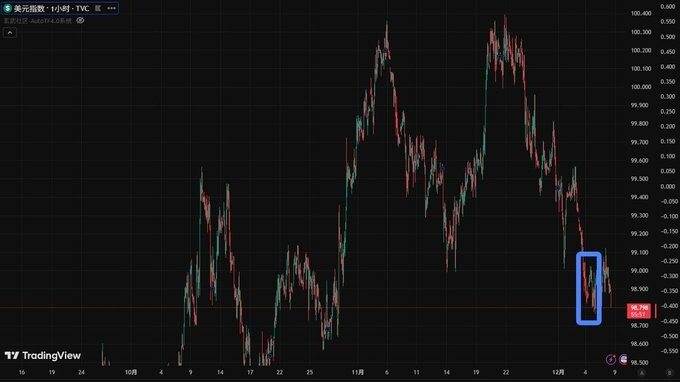
If there is any indicator that can influence short-term trends, it must be the flow of ETF funds. These products have always played a role in determining Bitcoin’s medium-term direction, and daily net inflows and outflows are often sensitive short-term signals. However, data from the past week shows that ETF fund flows were virtually zero. Although technically there was still an inflow, the amount was too small to provide any real support. In fact, ETFs do not participate in the price formation process. During periods when market direction is unclear, the lack of new demand becomes particularly important. When funds decrease, open positions remain unchanged, and ETFs withdraw from the market, price movements will be primarily influenced by order books rather than new funds. This shift explains why intraday price fluctuations become more similar to those driven by liquidity, rather than trends-driven increases. The DXY index has provided some support, but it wasn’t enough. The recent trend of the DXY index has generally been beneficial for Bitcoin. When the US dollar weakens or remains stable at low levels, Bitcoin tends to benefit from this inverse relationship. In fact, Bitcoin’s strength earlier this week was partly due to this factor. However, even if the US dollar strengthens, it cannot offset the weakness in crypto-related indicators. After December 5th, the DXY index entered a volatile phase, reducing the clarity of the inverse signal. At the same time, the negative impact of declining funds, positions, and ETF fund flows on market sentiment far outweighs any slight positive effects from macroeconomic conditions.Therefore, although the US Dollar Index explains why Bitcoin’s price hasn’t fallen significantly, it cannot reverse this trend that favors short-term weakness.
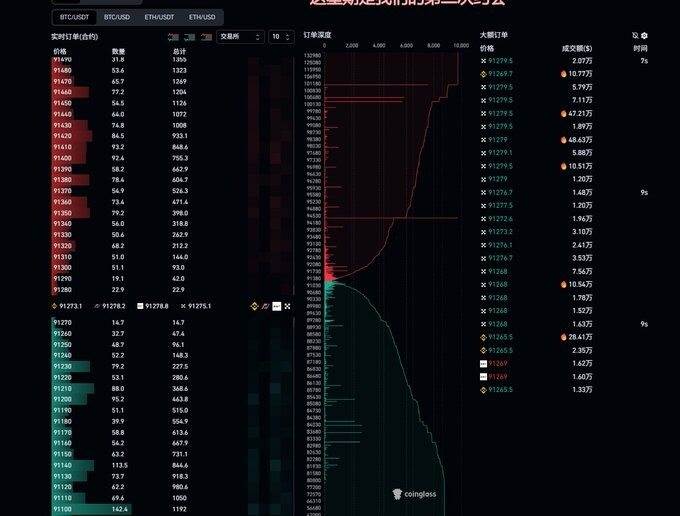
The liquidity in the order book indicates that selling pressure is too strong.
The next key information comes from real-time liquidity data. The buying side appears to have relatively weak depth, and there are no significant buyers providing effective support at current prices. On the other hand, selling pressure is more pronounced.
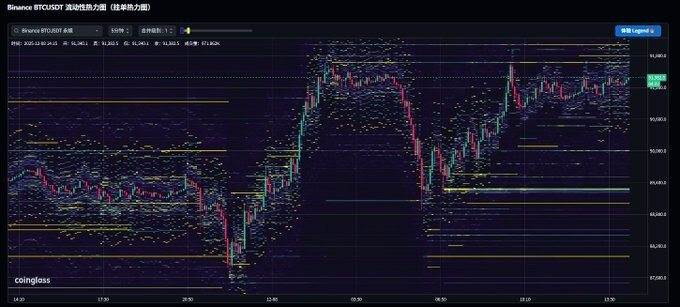
This imbalance is even more evident in the heatmap data. Areas with high selling activity around 91,800 and 92,200 constitute a significant resistance level. In contrast, areas of strong buying interest are much lower—around …… Price levels around 89,400 also represent significant resistance.
This pattern forms a clear trading channel: resistance above, support below. Without new inflows of capital, there’s little momentum for a breakout from these boundaries. Since bullish positions are decreasing, and ETFs aren’t participating either, the likelihood of a breakout upward is low. Instead, strong liquidity near 89400 points increases the possibility of demand absorption. If prices fall, there might be a short-term rebound.
Short-term trend: Bulls are weak, bears are passive.
Considering all the signals—capital flow, open positions, ETF activity, US Dollar Index, order book depth, and heatmap data—the current trend of Bitcoin can be summarized as follows:
“Upward pressure is limited, while downward support exists. However, the market still seems to be inclined towards a bearish trend in the short term.”
This isn’t a market crash, nor does it seem like the beginning of a sudden reversal in trends. Instead, it indicates that it’s difficult for the market to continue rising. The upward momentum isn’t strong enough to push prices higher, and the downward pressure isn’t strong enough to trigger a decisive crash. The lack of inflows from ETF funds is particularly important, as in this cycle, sustainable increases almost always require continuous support from institutional demand.
In other words, the market is weak and hesitant, and it’s becoming more and more automated in its behavior. The driving forces aren’t narrative or capital flows, but rather liquidity shortages and passive order behavior.
Why is the next macro catalyst crucial?
The upcoming interest rate cuts may cause some short-term fluctuations in Bitcoin prices, but even their potential positive effects should be interpreted with caution. Liquidity remains tight, and market sentiment seems weak.
Even if dovish signals bring temporary relief, the overall situation won’t change overnight. Structural demand still needs to play a role. What’s more interesting is that if the market believes the outcome will be disappointing, then market sentiment could quickly shift, breaking the current deadlock and leading to a clearer direction—perhaps downward, since the direction with the least resistance right now is downward.
Ironically, a failed “good news” event might actually end the recent sideways movement.
Building structured rating models
Given the current volatility of market signals, it becomes increasingly important to develop systematic scoring models that can analyze short-term, medium-term, and long-term indicators. Each indicator—such as financing rates, open interest levels, ETF flows, macroeconomic factors, liquidity concentration, and heatmap visualizations—has different weights depending on the time frame. In a 7-day forecast, short-term indicators like heatmap liquidity or daily changes in open interest should carry more significant weight. Medium-term analysis, on the other hand, should rely more on ETF positions and macroeconomic trends. Long-term predictions, however, need to take into account structural demand, clarity of regulatory policies, and supply-side factors such as halving events and broader applications. Through proper scoring, Bitcoin’s behavior can be transformed from subjective interpretation to quantitative analysis. The current allocation scores slightly lower on the short-term scale: it isn’t outright bearish, but due to weakened bullish interest, extremely low ETF participation, and significant liquidity resistance, the overall trend is slightly downward.