Exchange Ranking
 Top Exchanges
 24h Volume Ranking
 Popularity Ranking
 Exchange BTC Balance
 Proof of Reserves
 Decentralized Exchanges
 Funding Rate
 Funding Heatmap
 Liquidation Data
 Max Pain
 Long/Short Ratio
 Whale L/S Ratio
 Binance/Okex/Huobi L/S
 Bitfinex Margin L/S
 ETF Tracker
 Solana ETF
 XRP ETF
 Hong Kong ETF
 Bitcoin Treasuries
 Crypto Reversal
 Ethereum Reserves
 HyperLiquid Wallet Analysis
 Hyperliquid Whale Watch
 Large Transactions
 On-chain Movement
 Bitcoin ROI
 Stablecoin Market Cap
 Options Analysis
 News
 Articles
 Economic Calendar
 Features
 Wallet
 Contract Calculator


 Security
 Collections
 Watchlist
 Following
 BTC
 DOGE
New report says that the trading speed of Dogecoin can be increased by 300 times, but the price drops 4.2% in a single day.
A new report shows that the trading speed of Dogecoin may increase by as much as 300 times, but its price drops 4.2% in one day. This dogcoin price forecast started with a huge gap between technical news and market reaction.
Dogecoin originated in 2013. It was originally a project that treated cryptocurrencies in a relaxed and humorous way, built around Shiba Inu meme. Since then, it has become one of the largest digital assets by market value and has a large community of holders.
The price of Dogecoin today was $0.0849, down 4.2% in the past 24 hours. The trading range of this currency is $0.08119 to $0.08872, with a total market value of $13.266 billion. This puts it in 12th place. Anyone who follows the outlook for Dogecoin in 2026 will notice that the current price is near the bottom of the daily range.
Indicator Value Price $0.084924 Hour Change-4.2% 24 Hour Range $0.08119 - $0.08872 Market Value $13.266 billion Market Value Ranking #12 Data Source: Market data obtained from CoinGecko as of October 9, 2026. Data from other tracking sites may differ slightly.
DOGE News Today
The latest DOGE news comes from BSCN Newswire. Reports pointed out that financial technology company Metallicus has launched an Alpha version of DogecoinVM on Metal Blockchain's main website. The company said this increased DOGE's transaction speed by up to 300 times.
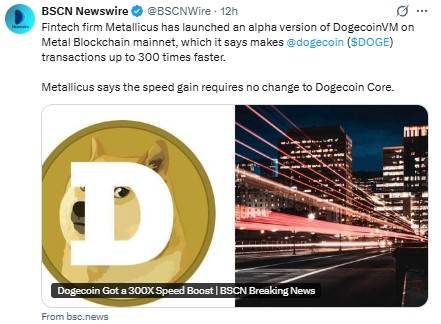 图片来源:取自@BSCNewsX账户数据
该公司还表示,速度的提升无需对Dogecoin Core进行任何更改。此次发布的是Alpha版本,且关于速度的声明来自公司自身,因此我们无法验证其真实性。在钱包、商家和交易所采用之前,它尚不会影响需求。过去一天价格下跌,表明市场尚未做出积极反应。
狗狗币技术分析
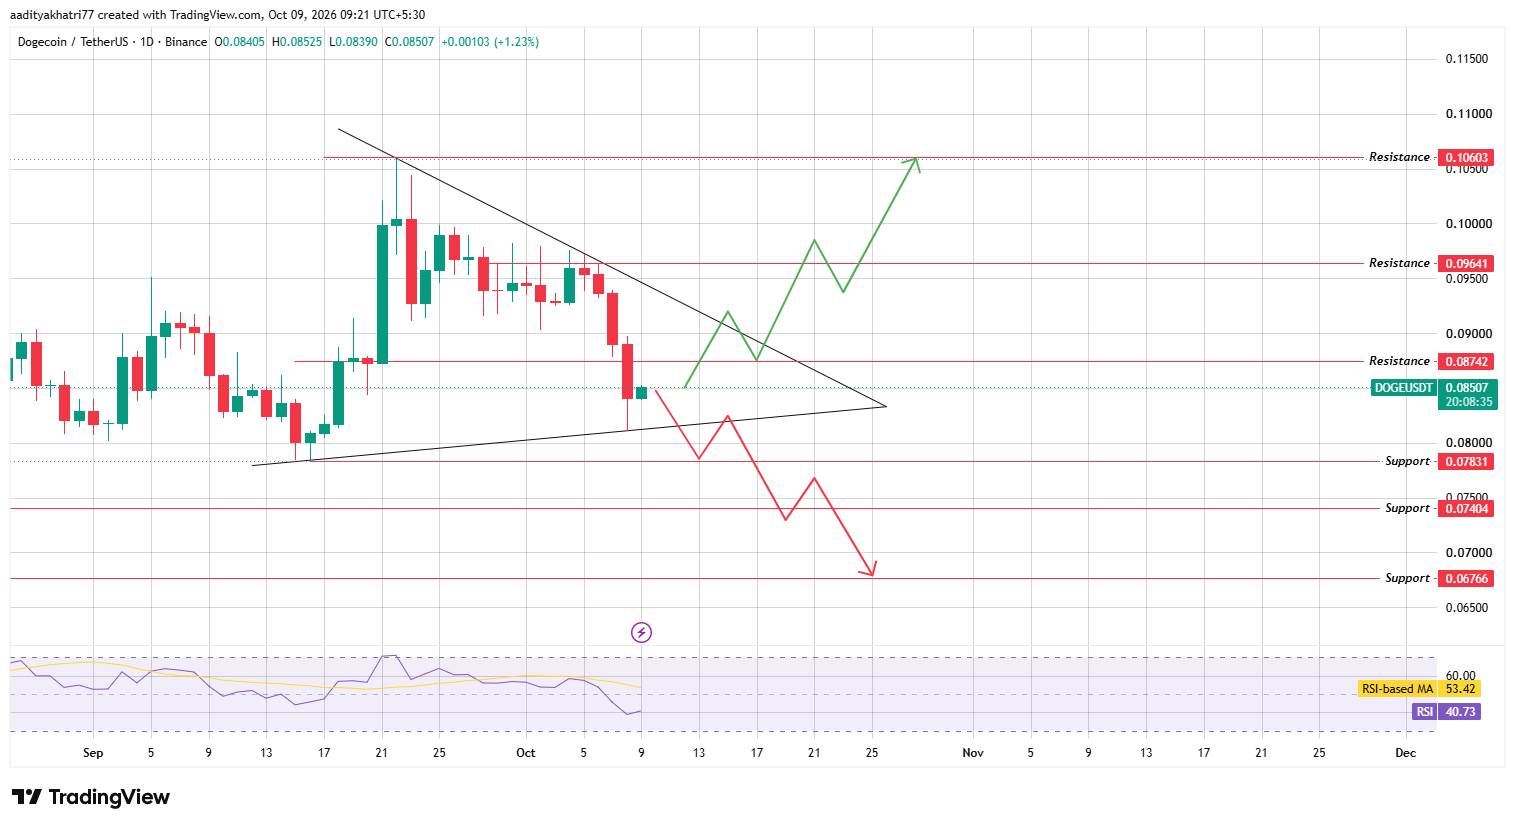
日线图显示DOGE处于一个不对称三角形内。从9月下旬高点形成的下降趋势线构成了上边,而从9月中旬低点形成的上升趋势线构成了下边。
这两条线将在10月下旬交汇,因此在此之前可能会出现决定性走势。在10月8日大幅下跌后,$DOGE在Binance上的交易价格接近0.08507。在随后的下跌中,上升趋势线得到了支撑。当前日线蜡烛上涨1.23%,将于10月10日印度标准时间05:30(协调世界时00:00)收盘。
相对强弱指数(RSI)为40.73,低于其移动平均值53.42。动能疲软,但读数并未超卖。因此,我们的狗狗币技术分析等待价格和成交量确认下一步走势。
狗狗币价格预测:DOGE能否突破三角形?
看涨情形
The bullish situation starts at the resistance level of 0.08742, which is about 2.8% above the chart price of 0.08507. If the daily closing price is above this position and the trading volume is above the 20-day average, it will be the first confirmation signal.
The next step is for the daily price to close above the triangular downtrend line. The trend line is above 0.08742 and slopes downward every day, so the breakthrough level continues to decrease. If the price closes above this line with strong trading volume, it will indicate that the buyer is in control of the situation.
If both breakthroughs are true, the chart points to 0.09641, which is approximately 13.3% higher than the current price. The target for further gains will be 0.10603, about 24.6% above chart prices. This level is in line with its high in late September.
BELOW Scenario
BELOW Scenario begins when the daily closing price is below the uptrend line and selling volume is above the 20-day average. This would end a series of higher lows that have formed since mid-September.
The next step is for the daily price to close below the support level of 0.07831, which is about 7.9% below the chart price. This level is in line with the low set in mid-September. A confirmation of a break will open the path to 0.07404, with a decline of approximately 13.0%.
The final support level on the chart is 0.06766, a decrease of about 20.5%. The weak RSI has added to caution as it has not yet recovered.
Price levels to watch
These levels are from daily charts and are based on closing prices.
Support Resistance 0.078310.087420.074040.096410.067660.10603 Bully, benchmark and bearish scenarios
Scenario Set target levels看涨 (Bull)日线收盘价高于阻力位,随后高于下降趋势线,且成交量高于平均水平0.09641 - 0.10603基准 (Base)价格在两条趋势线之间的三角形内保持0.07831 - 0.08742看跌 (Bear)日线收盘价低于上升趋势线,随后低于支持位,且成交量上升0.07404 - 0.06766 狗狗币 vs 比特币
$DOGE在过去24小时内对美元下跌4.2%,对比特币下跌3.5%。简单的算术表明,比特币对美元的跌幅不到1%。因此,$DOGE的跌幅远大于最大的加密货币资产。这种差距对于模因币来说很常见,它们在两个方向上的波动往往都大于比特币。
稳定的比特币行情有助于DOGE守住上升趋势线。更深的比特币下跌可能会将其拉向0.07831。
方法论
本狗狗币价格预测使用三个输入。水平位、对称三角形和RSI均来自TradingView上2026年10月9日印度标准时间09:21捕获的Binance DOGE/USDT日线图。市场数据来自CoinGecko快照。新闻项来自BSCN Newswire帖子。
图表价格0.08507与CoinGecko价格0.0849略有不同。两个来源使用不同的交易所数据和不同的时间窗口。图表蜡烛自协调世界时00:00以来上涨1.23%,而CoinGecko显示滚动24小时下跌4.2%。我们使用图表价格计算百分比距离,使用CoinGecko价格作为标题数字。
We only accept breakthroughs or breaks when the daily candle closes and volume is above the 20th average. This mean is our own confirmation criterion and not from a chart. No clearing or exchange volume data is available, so they are not used.
Expert opinion
General market commentary on symmetrical triangles states that they show squeeze rather than direction. Prices move within a narrow range until the close exceeds one of the trend lines to determine the outcome.
The same comment warns that early breakthroughs will often fail if volume is not matched. For DOGE, daily closing prices above 0.08742 and downtrend lines will favor buyers. Closing prices below the uptrend line will benefit sellers. Network upgrades can boost market sentiment, but prices often follow adoption rates and demand.