Exchange Ranking
 Top Exchanges
 24h Volume Ranking
 Popularity Ranking
 Exchange BTC Balance
 Proof of Reserves
 Decentralized Exchanges
 Funding Rate
 Funding Heatmap
 Liquidation Data
 Max Pain
 Long/Short Ratio
 Whale L/S Ratio
 Binance/Okex/Huobi L/S
 Bitfinex Margin L/S
 ETF Tracker
 Solana ETF
 XRP ETF
 Hong Kong ETF
 Bitcoin Treasuries
 Crypto Reversal
 Ethereum Reserves
 HyperLiquid Wallet Analysis
 Hyperliquid Whale Watch
 Large Transactions
 On-chain Movement
 Bitcoin ROI
 Stablecoin Market Cap
 Options Analysis
 News
News Articles
 Economic Calendar
 Features
 Wallet
 Contract Calculator


 Security
 Collections
 Watchlist
 Following
 BTC
BTC Bitcoin prices face a test of a 365-day moving average near $81,700 after a 24% rebound
Bitcoin prices have consolidated in the range of $76,000 to $82,000 after experiencing a strong 24% rebound in two weeks, and are currently trading close to $77,000. CryptoQuant described the recovery as "constructive" but also pointed to several obstacles that buyers must overcome.
Its September 11 report pointed out that the main technical resistance level was at $81,700. At the same time, the latest views from other analysts highlighted weekly resistance and persistent long whale positions, adding a touch of caution to the recovery outlook.
Bitcoin prices experience heavy supply pressure below the annual moving average
Julio Moreno, head of research at CryptoQuant, pointed out that US$77,100 to US$80,200 is the area with the most concentrated selling pressure in recent times. In the past 30 days this year, long-term holders have sold as many as 539,000 BTC units in the region.
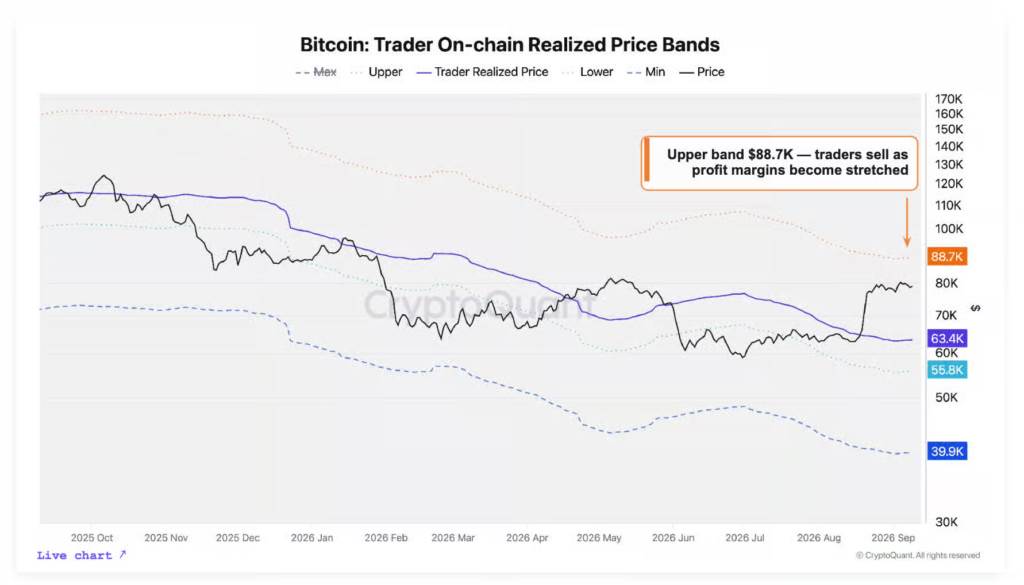 Source:CryptoQuant #@0_7#@ Above this region, Bitcoin prices will face a 365-day moving average of approximately US$81,700. Within his framework, Moreno believes that a closing price breaking through that moving average will be a sign of confirmation of a new bull market.
The next BTC resistance level is around $83,600, corresponding to CryptoQuant's 3x Metcalfe valuation band. The model uses network activity, including the number of active addresses, to estimate value.
Another obstacle emerged at $88,700, which is the upper limit band for its trader realization of the price model. Moreno said historically active traders have typically taken profits near the border.
Weekly recovery and whale positions draw traders 'attention
Rekt Capital pointed out that approximately US$78,300 is a key level, and the Bitcoin price needs to recover and retest this level as support to rise further. His update warned that if weekly prices close below this level, it could be similar to the weaker structure observed in May.
#BTC
Bitcoin continues to position below ~$78300, which is the weekly level at which the price needs to be successfully retested as support to move upward.
Currently, prices are below this level and are preparing to form weekly closing prices below this level, which is similar to the situation in May 2026.
After such a weekly close...
-- Rekt Capital (@rektcapital) September 12, 2026
In addition, Ted Pillows noted that despite the market rebound, Bitfinex's whales maintained long positions. He pointed out that this contrasts with their historical tendency to reduce long positions during periods of market gains.
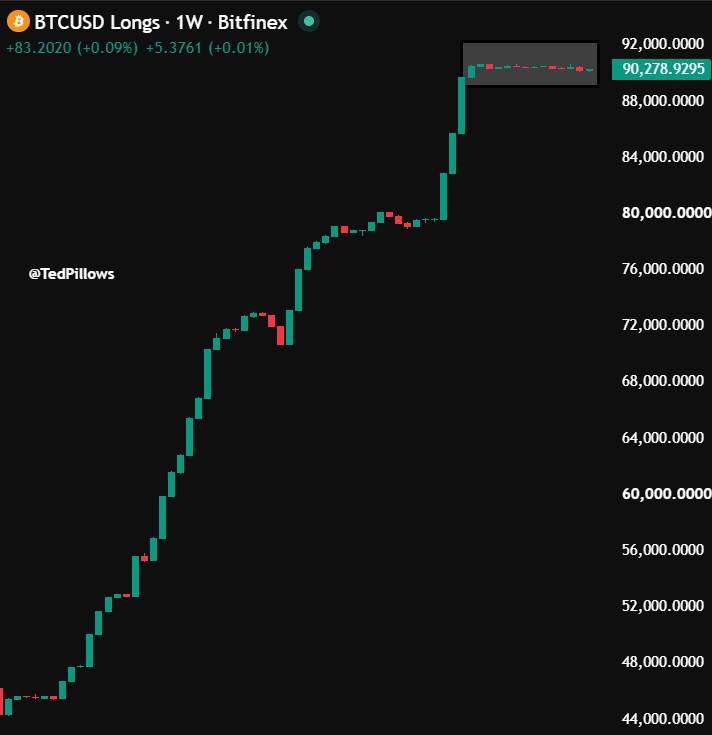 Source: X These positions alone do not determine whether the whales expect further declines. Pillows also highlighted the game between sellers around $80,000 and buyers around $76,000.
If Bitcoin prices fall further, CryptoQuant points out that the 200-day moving average near $70,000 could be a potential support level. The deeper support area lies between US$62,000 and US$65,000, with long-term holders accumulating approximately 476,000 BTC in this area this year.
Disclaimer : This article is for reference only and does not constitute financial advice. CoinCryptoNewz is not responsible for any losses. Readers should conduct independent research before making financial decisions.