Exchange Ranking
 Top Exchanges
 24h Volume Ranking
 Popularity Ranking
 Exchange BTC Balance
 Proof of Reserves
 Decentralized Exchanges
 Funding Rate
 Funding Heatmap
 Liquidation Data
 Max Pain
 Long/Short Ratio
 Whale L/S Ratio
 Binance/Okex/Huobi L/S
 Bitfinex Margin L/S
 ETF Tracker
 Solana ETF
 XRP ETF
 Hong Kong ETF
 Bitcoin Treasuries
 Crypto Reversal
 Ethereum Reserves
 HyperLiquid Wallet Analysis
 Hyperliquid Whale Watch
 Large Transactions
 On-chain Movement
 Bitcoin ROI
 Stablecoin Market Cap
 Options Analysis
 News
 Articles
 Economic Calendar
 Features
 Wallet
 Contract Calculator


 Security
 Collections
 Watchlist
 Following
 XRP
XRP price analysis today: The selling pressure is huge, and the key support level is about to be tested.
In today's widespread selling in the cryptocurrency market, XRP prices have been hit hard, with a drop of about 6%, falling to about US$1.34 as of press time. This trend is much the same as the reasons driving Bitcoin towards $80,000. Rising Treasury yields, renewed market expectations of tightening Fed policies, a stronger US dollar and a large number of liquidations of leveraged crypto positions have all put pressure on risky assets.
This also means that yesterday's bearish XRP scenario unfolded almost exactly as expected:
- Scenario: bearish
- Yesterday set: $1.41 fell, market-wide selling continued
- Results: XRP fell below $1.41, moving towards the $1.30-$1.33 area
The question now is whether XRP can stabilize after reaching extremely oversold conditions, or whether another round of downturns is coming.
The XRP price chart shows huge selling pressure
The four-hour chart shows a significant deterioration in the structure. XRP consolidated in the range of approximately $1.48 to $1.53 for most of late September to early October. This range was decisively broken through. Subsequently, the price lost support at $1.45 and $1.40 one after another, and finally moved towards $1.34 through a series of fast red K lines.
The first immediate support level is currently around US$1.33 -1.34. Below this, the 200-day moving average becomes crucial, with its position close to $1.28. 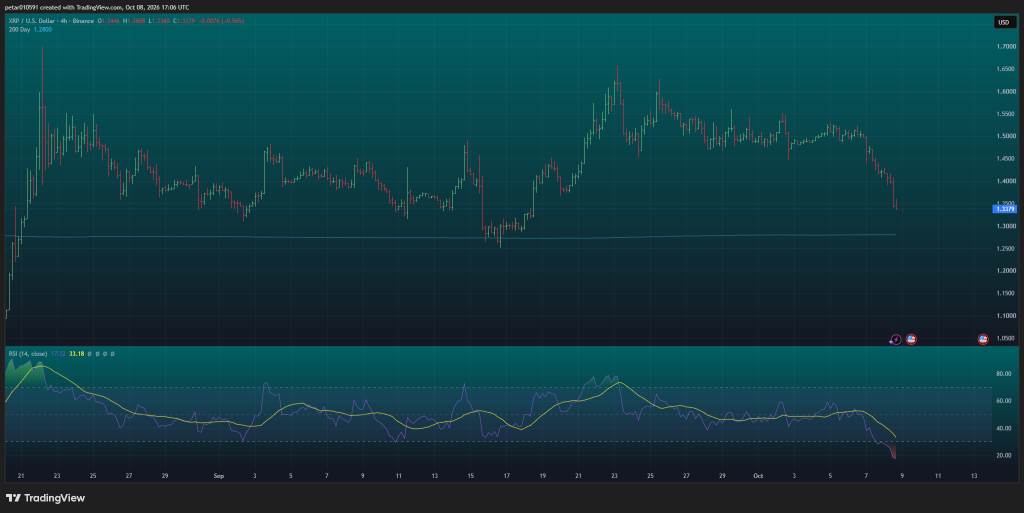 Source: TradingView
This provides a fairly clear technical support band for XRP, ranging from approximately $1.28 to $1.33. If the area falls, the chart shape will weaken significantly. In terms of resistance,$1.38-$1.40 is now the first resistance area. It served as support before the region fell today. Above it,$1.45 becomes the next important level of recovery.
The RSI indicator is extremely oversold
The most eye-catching indicator on the chart is the Relative Strength Index (RSI). The RSI on the four-hour chart has dropped to about 17. This is well below the traditional oversold threshold of 30. Its moving average is around 33, showing how quickly momentum has deteriorated in the latest round of selling. An RSI close to 17 does not guarantee a rebound, but it tells us that the XRP has stretched significantly in the downward direction. This makes a short-term easing rebound increasingly likely.
The problem is that extremely oversold markets can remain oversold when selling pressures are driven by broader macro events. Therefore, XRP still requires price confirmation. A rebound that cannot recover the $1.38 -1.40 area will be weak.
The 200-day moving average is a ready-made key defense line
The 200-day moving average is near US$1.28, possibly the most important key downside position on the chart. XRP came close to the region for the last time during its September decline, before recovering strongly. So successfully defending $1.28-$1.30 would provide bulls with another technical reason to expect a rebound. But if the 200-day moving average continues to fall below, the situation will be much more serious. This could expose near the September low of $1.25 and could open a path to the $1.20 area.
October 9 XRP Price Forecast
As XRP is currently extremely oversold, the situation on October 9 is more balanced than it looks. The trend is bearish, but after such a large decline, there may be a quick relief rally.
The bullish scenario depends on XRP holding steady around $1.33 -1.34 and quickly recovering above $1.38. If this happens, the next test target will be $1.40, followed by $1.44 -1.45. In a neutral scenario, XRP will consolidate between $1.31 and $1.38 on October 9 to absorb the latest market-wide sell-off. If Bitcoin continues to fall and macro pressures remain high, a bearish scenario remains highly likely. If $1.33 falls, the focus will shift to $1.30, followed by the 200-day moving average near $1.28. If $1.28 also falls, the September low near $1.25 will become the next major level.
For October 9, the $1.28 -1.33 region is the most critical range. XRP is oversold enough to trigger a rebound, but the chart still needs to prove that sellers are losing control.