Exchange Ranking
 Top Exchanges
 24h Volume Ranking
 Popularity Ranking
 Exchange BTC Balance
 Proof of Reserves
 Decentralized Exchanges
 Funding Rate
 Funding Heatmap
 Liquidation Data
 Max Pain
 Long/Short Ratio
 Whale L/S Ratio
 Binance/Okex/Huobi L/S
 Bitfinex Margin L/S
 ETF Tracker
 Solana ETF
 XRP ETF
 Hong Kong ETF
 Bitcoin Treasuries
 Crypto Reversal
 Ethereum Reserves
 HyperLiquid Wallet Analysis
 Hyperliquid Whale Watch
 Large Transactions
 On-chain Movement
 Bitcoin ROI
 Stablecoin Market Cap
 Options Analysis
 News
 Articles
 Economic Calendar
 Features
 Wallet
 Contract Calculator


 Security
 Collections
 Watchlist
 Following
 HBAR
Hedera (HBAR) has experienced a significant correction over the past two weeks, falling about 24% from its September 28 close and moving back towards the $0.09 area. However, analyst Lana Valentis believes Hedera's weekly chart may be preparing for another strong rally.
Her bullish logic is based on two main points: one is the retesting of key support and resistance areas; the other is the continuous deepening of Hedera's tokenized narrative.
HBAR is retesting the important weekly interval
Valentis analysis chart shows that the current market game is concentrated in the $0.084 to $0.093 range. The region has previously served as an important price turning point and was tested again after the latest round of correction. Its chart structure takes on a pattern similar to a "circular bottom", with HBAR recovering from summer lows and retreating back to the same key area.
If the buyer can hold this area, the primary upside target is approximately US$0.13. After breaking through this position, the chart further maps higher targets such as $0.20,$0.31, and even the final $0.40.
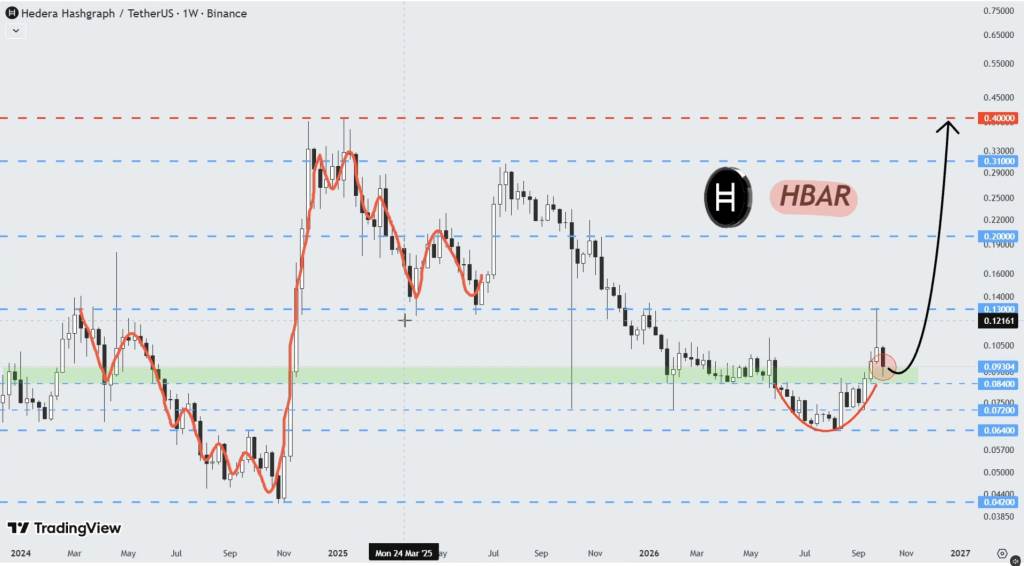
US$0.13 is the most realistic first test point because it coincides with the previous resistance zone and the recent band structure.
Stock tokens add new impetus to Hedera narrative
Valentis also pointed out that Hedera is growing in tokenization application scenarios. Users can now access tokenized equity exposure through HashPack and SODAX, adding another real-world asset (RWA) perspective to the network. This move is in line with Hedera's broader deployment in the areas of institutional tokenization and enterprise infrastructure.
The market responded positively to this in late September, when The Hashgraph Group's IDTrust was verified and included in the IBM Cloud Catalog. While this development remains valid, it should not be seen as evidence of IBM's direct adoption of HBAR, nor should it be automatically inferred that it will create demand for tokens.
The latest 24% correction shows that positive ecosystem news alone is not enough to drive prices higher without technical support.
Hedera price forecast
The main range to focus on is US$0.084 to US$0.09. If HBAR holds on to the area and begins to recover,$0.13 will become the first major target. If it can break through US$0.13 strongly, US$0.20 will come into view, followed by the more ambitious US$0.31 and US$0.40 targets in Valentis chart.
However, if support falls, the overall bullish pattern will quickly weaken. For now, the chart is worth noting because HBAR has returned to a historically critical area after a sharp correction. The key to bullish logic is whether the buyer can prove that it can hold that support level.