Exchange Ranking
 Top Exchanges
 24h Volume Ranking
 Popularity Ranking
 Exchange BTC Balance
 Proof of Reserves
 Decentralized Exchanges
 Funding Rate
 Funding Heatmap
 Liquidation Data
 Max Pain
 Long/Short Ratio
 Whale L/S Ratio
 Binance/Okex/Huobi L/S
 Bitfinex Margin L/S
 ETF Tracker
 Solana ETF
 XRP ETF
 Hong Kong ETF
 Bitcoin Treasuries
 Crypto Reversal
 Ethereum Reserves
 HyperLiquid Wallet Analysis
 Hyperliquid Whale Watch
 Large Transactions
 On-chain Movement
 Bitcoin ROI
 Stablecoin Market Cap
 Options Analysis
 News
 Articles
 Economic Calendar
 Features
 Wallet
 Contract Calculator


 Security
 Collections
 Watchlist
 Following
It has been 10 days since our last analysis regarding the silver market. The events that occurred 10 days ago seem to have become part of the past. In this short period of time, the silver market has experienced a series of important developments:
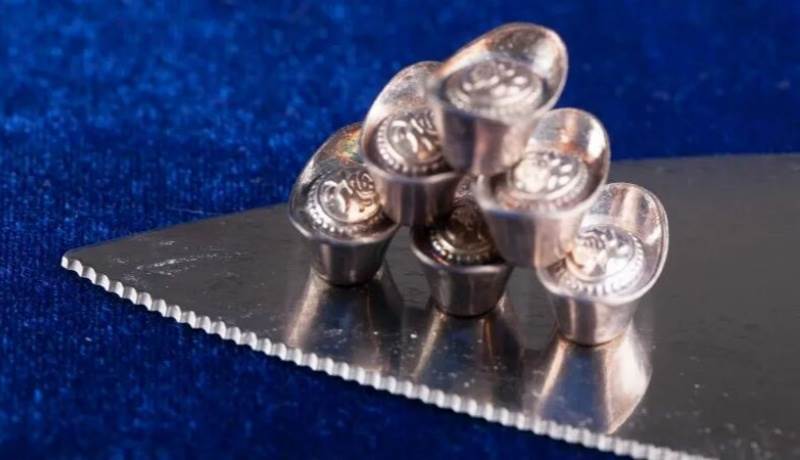
● China announced that a licensing system will be implemented for silver exports starting from January 1st next year.
● The price of physical silver in Shanghai rose to $91, while the settlement price at the COMEX (New York Commodity Exchange) was $77.
● The forward curve in London remains in a state of backwardation. Although it isn’t as extreme as it was in October, it still shows an inverted pattern.
● CME (Chicago Mercantile Exchange) increased the margin requirements for silver trading.
● After experiencing what could be considered a “detoxification” in the digital world, I spent the entire afternoon analyzing data from Bloomberg and Rose, trying to determine whether these changes would affect our market perspectives.
Short-term conclusion: This is not a good time to make new investments.
I will wait for opportunities to take profits during upcoming corrections, while remaining flexible when dealing with options.
This is exactly what trading books don’t teach you—when your investment logic works, even too well, you need to manage not only your funds but also your emotional resilience. At such times, mathematical models derived from calculations on paper become nothing more than “realized returns” in the form of bullish options.
This stage is unsettling, as you need to do more work: re-evaluate your calculations and consider any potential negative narratives that could affect you.
This is the current situation.
Bear market warnings (or: potentially “dangerous” risk factors)
In the next two weeks, silver bulls will have to deal with various factors that could lead to bearish sentiment in the short term.
Don’t be surprised by the upcoming “negative results”; it’s very likely to happen. The key is whether you choose to buy at these low prices. We’ve shifted some of our “Delta” positions to gold, adjusting our trading portfolio. Currently, we hold around 15% gold positions and 30%-40% silver positions, compared to earlier levels where this ratio was closer to 10:1.
Additionally, we’ve purchased some bullish butterfly options, as well as a significant number of USD call options. The logic behind these actions will become clearer over time.
Anyway, here are some of the main factors that could create bearish pressure:
Tax-related selling pressures
You’ve already made quite a profit from these trades, possibly so much that even your accountant might be surprised. For investors who bought silver by exercising long-term bullish options, they may be reluctant to sell their positions before December 31st.
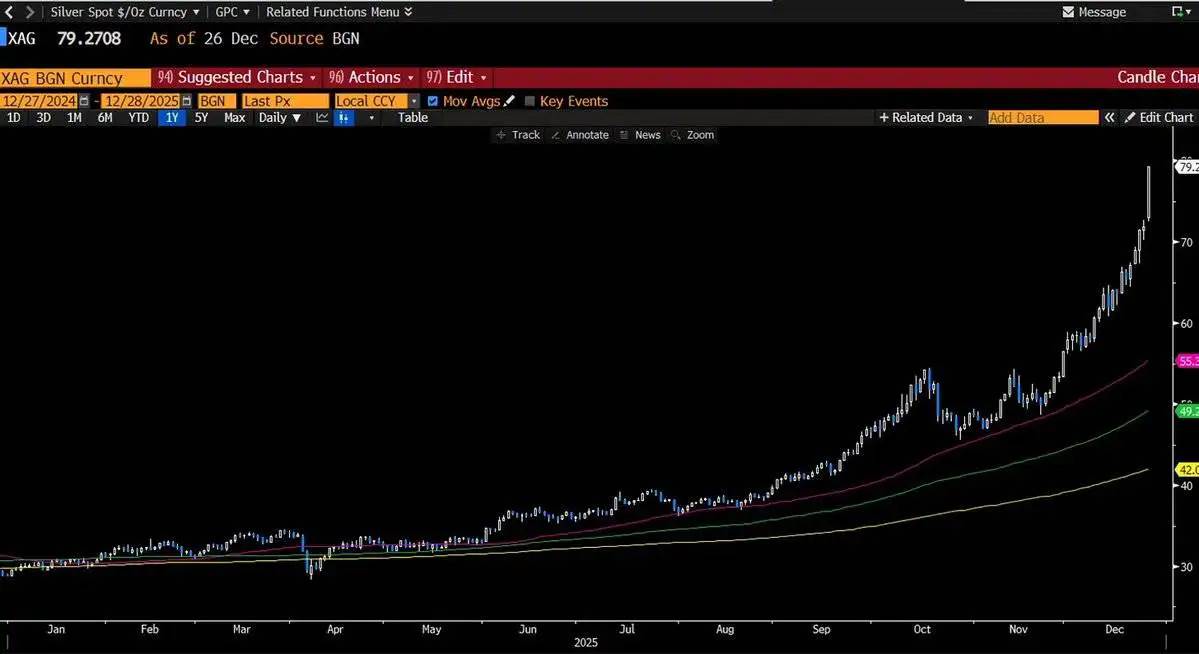
Especially when these positions have been held for less than a year, as it involves not only capital gains tax but also differences in short-term and long-term tax treatment.
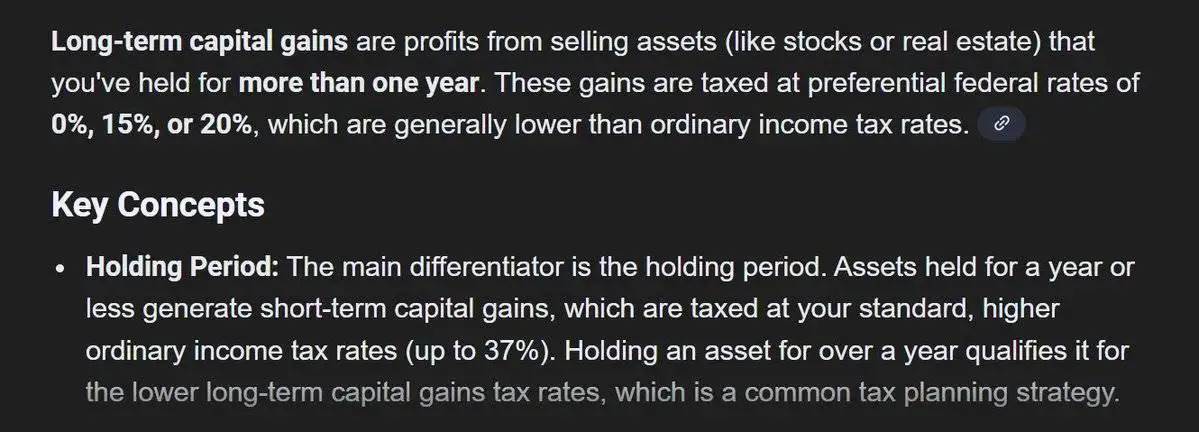
This means that there will be upward pressure currently, but after January 2nd, the situation will shift towards downward pressure.
Issues related to the US dollar and interest rates
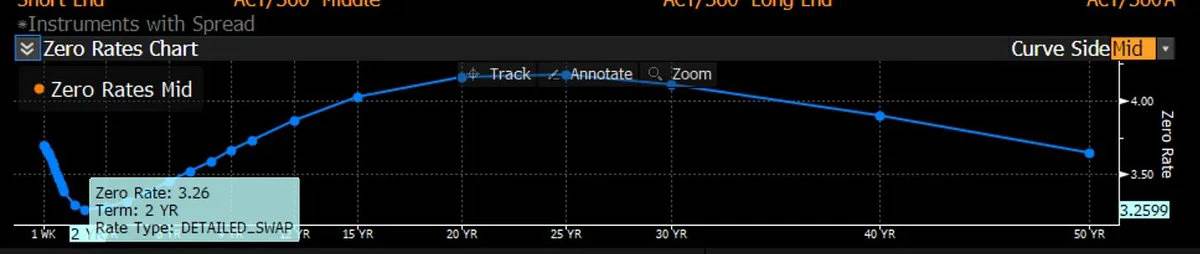
The latest GDP data shows strong performance, which may weaken expectations of a loosening of the 2-year Treasury yield curve. This could force policymakers to choose between a stronger US dollar and higher short-term interest rates. Either scenario would be bad news for precious metals denominated in US dollars, such as silver and gold.
Increased margin requirements
The CME (Chicago Mercantile Exchange) announced that margin requirements for precious metals will be increased starting from December 29th.
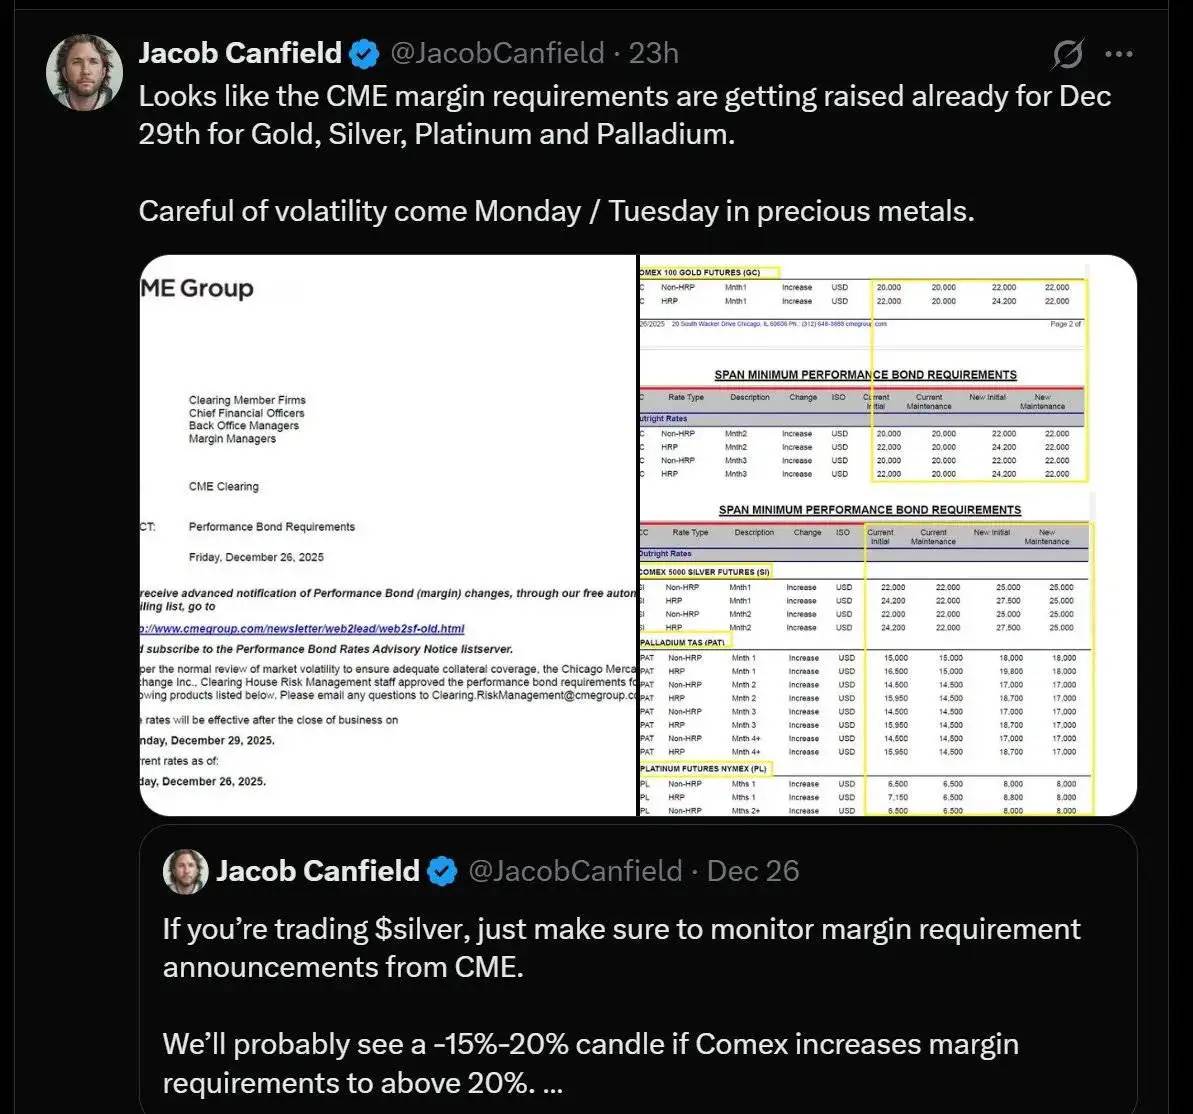
If you use leverage in the futures market, this change could have a significant impact on you. Higher margin requirements = higher capital requirements = forced liquidations for investors with insufficient funds. This is similar to what happened in the silver market crash in 2011, when the CME increased margin requirements five times within eight days, causing leverage ratios to plummet and ending the rise in silver prices.
So, is there any reason to worry? In fact, the situation isn’t that bad. After all, the margin requirements for silver are already much higher than they were in 2011. Therefore, while the recent increase does have an impact, it’s relatively minor. Additionally, most of the demand in the silver market now comes from physical purchases, which is very different from the situation in 2011.
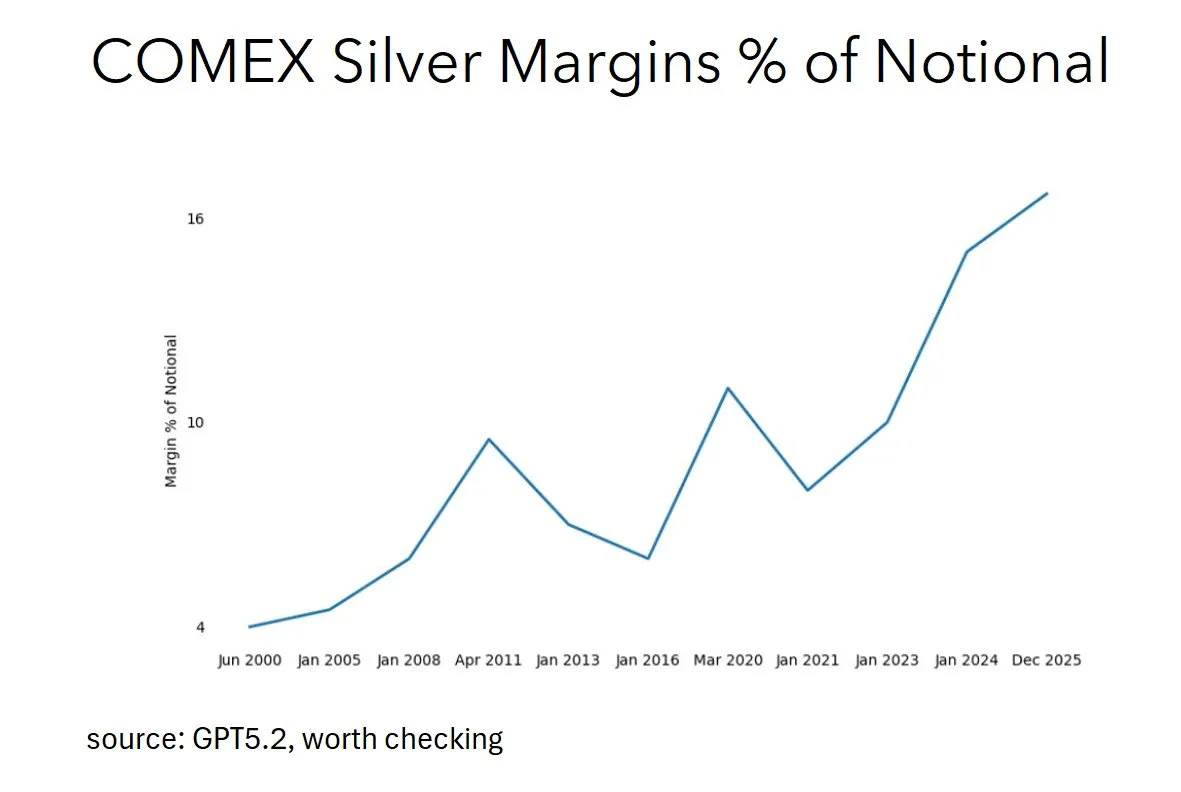
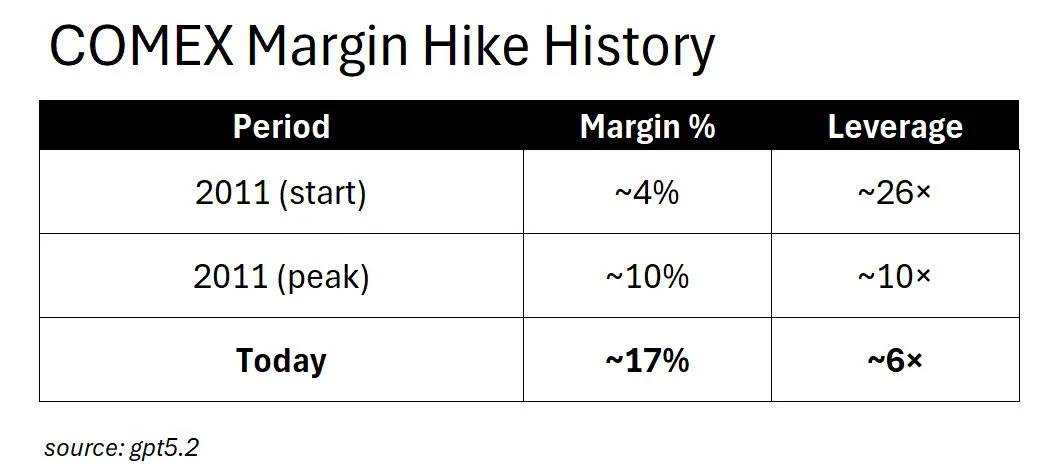
Looking back at 2011, the margin requirements for silver were initially only about 4% of the nominal value. In other words, investors needed to invest just $4 in capital to control assets worth $100—this represented a leverage ratio of 25 times, which was extremely risky. Subsequently, within a few weeks, the CME increased the margin requirement to around 10%. The leverage ratio dropped sharply from 25 times to 10 times, and the chain reaction of forced liquidations essentially halted the rise in silver prices during that period.
What about today? Currently, the margin requirement for silver has risen to around 17%, which corresponds to a leverage ratio of 6 times. This is even stricter than the strictest margin requirements in 2011.
The current market situation has entered a “post-squeeze” phase regarding margin requirements. So what will happening if the margin requirements continue to be raised? The answer is: There will be no more panic selling by speculators, as there are already not many speculative positions left in the market to liquidate. Instead, these adjustments will have a greater impact on hedgers, such as those who try to lock in prices, refiners who manage inventory risks, and commercial players who rely on futures markets to operate their businesses.
If the margin requirement were raised to 20%, we wouldn’t see the same chain reactions of forced liquidations that occurred in 2011. The real consequences would be reduced liquidity, widening price spreads, and commercial players shifting to over-the-counter (OTC) markets. The operating mechanisms of the market have fundamentally changed.
Therefore, those who warn about the potential increase in margin requirements are actually engaged in a “last stand” battle (assuming the analysis above is correct). While this rhetoric may help to create a “counter-narrative” in the short term, its practical significance is limited.
The emergence of claims regarding “overbought conditions”
When these factors come into play, you’ll hear those “chart astrologers” on FinTwit constantly talk about “overbought conditions”. Technical selling often leads to further technical selling, creating a negative cycle.
But the question is, what is “overbought” relative to?
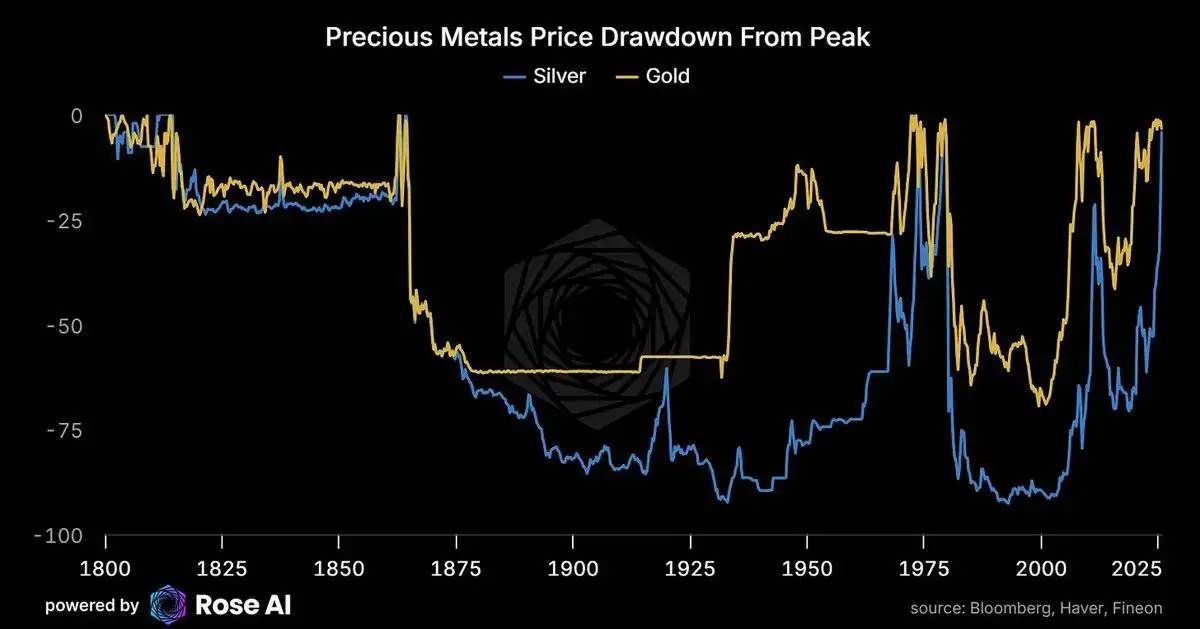
The investment logic behind silver isn’t based on technical charts or any kind of “chart astrology”. What really drives silver prices are its supply and demand fundamentals: the economic benefits of solar panels (with low demand elasticity, and silver accounting for only about 10% of the cost of solar panels) versus the rigid supply of silver itself (75% of silver is a byproduct of other metals). These are the real factors that drive short-term price fluctuations.
Additionally, silver has just reached a new all-time high. Do you know what else can reach new highs? Assets that continue to rise in value.
The theory of copper substitution
This is one of the most common arguments used by opponents: “They will replace silver with copper.”
Well, there’s some merit to this argument, but let’s do some calculations carefully.
The reality of copper substitution (or: four years is a long time)
There are indeed concerns regarding the slow pace of copper substitution.
These are actual mathematical calculations, not mere speculations.
Time is the key limiting factor.
Even if there were unlimited funds available, the conversion process would still be limited by physical constraints.
There are approximately 300 factories worldwide that produce solar cells.
It would take 1.5 years to convert each factory into a facility equipped with copper coatings.
The maximum capacity for parallel conversion is 60 factories per year.
It would take at least 4 years to achieve a 50% substitution rate.
Considering these time requirements, 1.5 years is a reasonable time frame for making such decisions. In other words, CFOs should rush to approve this transformation plan.
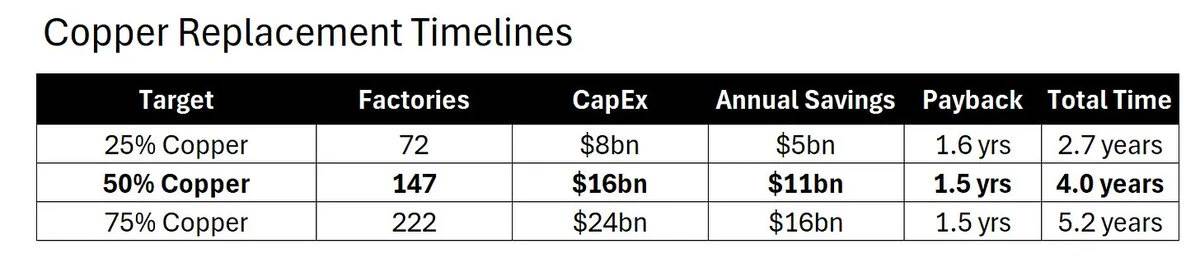
But even so, it still takes at least 4 years to complete half of the conversion work.
Factories need to be transformed one by one, engineers need to be retrained, the formulas for copper coatings need to be revalidated, and supply chains need to be adjusted accordingly. All of these require time.
The elasticity of demand needs to be calculated carefully.
Solar manufacturers have already adapted to the 3-fold increase in the price of silver. Let’s see how this affects their profits:
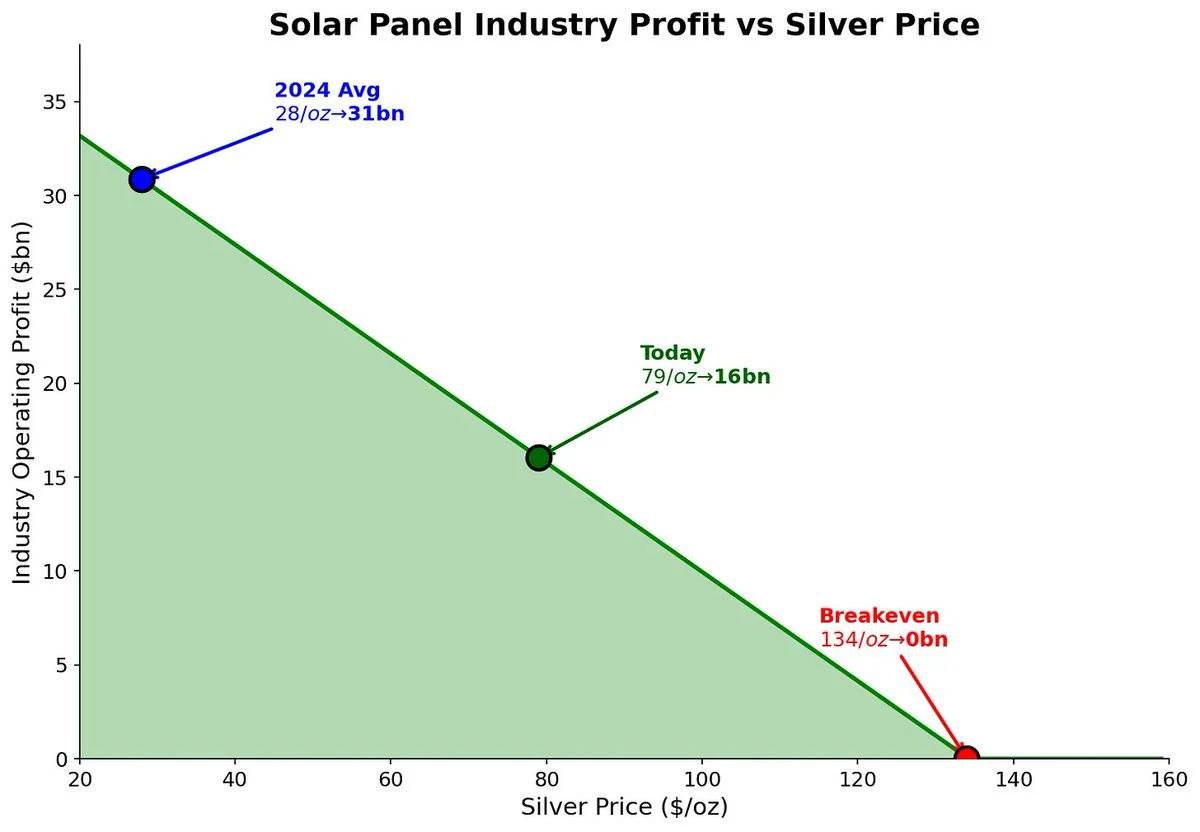
When the price of silver was $28 per ounce (average price in 2024), the industry’s profit was $31 billion.
● When the price of silver rises to $79 per ounce (current price), industry profits drop to $16 billion. Even though profits are halved, companies still continue to purchase silver.
Where is the break-even point?
Only when the price of silver reaches $134 per ounce will demand disruption begin to occur. This price is 70% higher than the current spot price.
It’s important to note that $134 per ounce isn’t a target price, but rather the starting point for demand disruption.
The threshold for urgency
As the price of silver continues to rise, the economic benefits of replacing silver with copper become even more attractive.
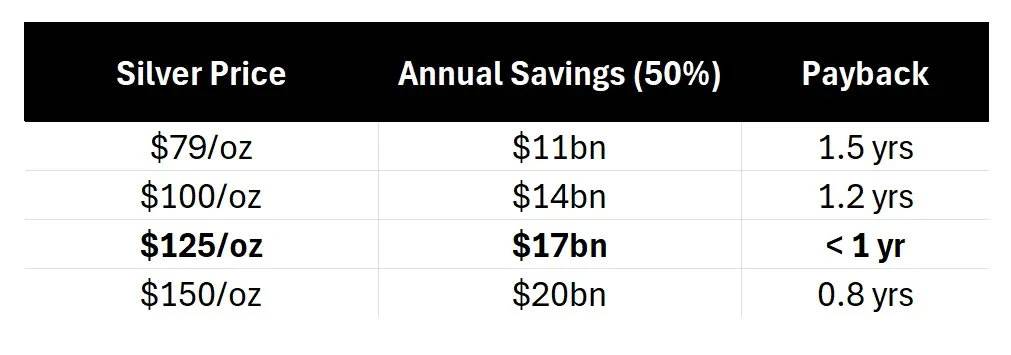
When the price of silver reaches $125 per ounce, the payback period for replacing silver with copper will be less than one year. By then, every board meeting might discuss the issue of replacing silver with copper. However, even if all companies make decisions tomorrow, it will still take four years to achieve 50% substitution. Meanwhile, $125 per ounce is still 50% higher than the current spot price.
Capital is urging people to “act quickly”, while reality says “wait”.
A paradox of intensity
Interestingly, while everyone is talking about replacing silver with copper, the solar industry is actually moving towards using panels that contain more silver.
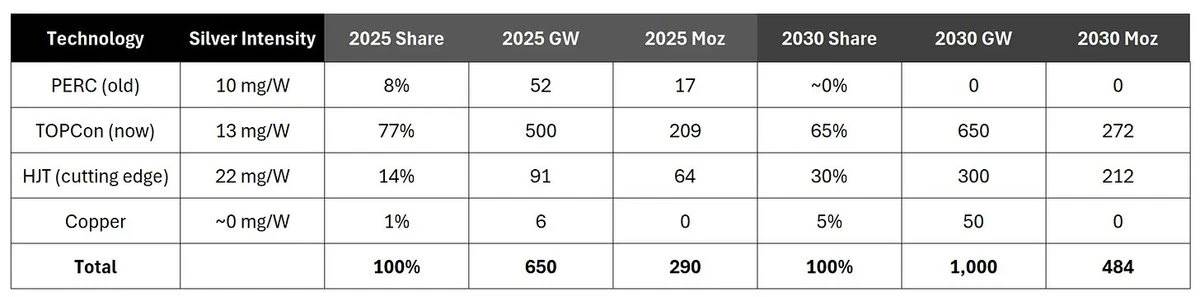
Weighted average silver usage:
● In 2025: approximately 13.5 milligrams per watt
● 2030 年:约 15.2 毫克/瓦
从 PERC 到 TOPCon 再到 HJT(异质结)技术的转变,实际上增加了每瓦太阳能板的白银用量,即使铜在某些方面逐步取代白银。但需要注意的是,尽管每种技术的银用量效率会随着时间提高,但没有大规模的铜投资计划,行业整体上正朝着每瓦使用更多白银的方向发展,而不是更少。
空头们在谈论铜替代,而行业实际上正在采用 HJT 技术。
关于铜替代的结论
时间在流逝,但流逝得很慢。
白银价格的上涨速度要快于工厂改造的速度。4 年的窗口期是白银多头逻辑的保护伞:白银价格有 70% 的上涨空间才能触发需求破坏,而即使铜替代今天开始,也无法在短期内赶上白银的涨势。
白银多头逻辑(或者说:为什么这波行情可能“撕裂你,但令人愉悦”)
好的。坏情况已经处理了。现在让我们谈谈我为什么仍然看涨。
中国正在“武器化”白银
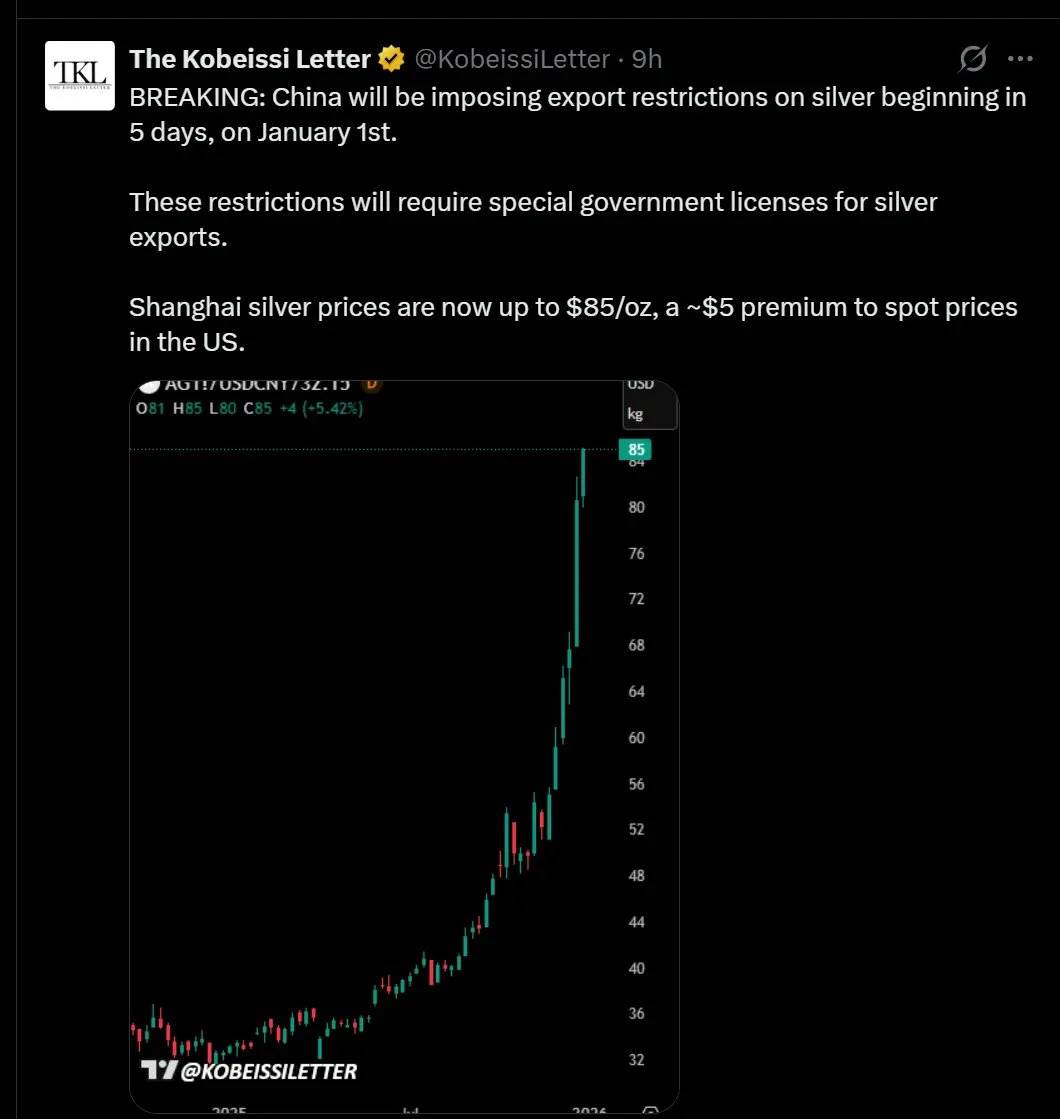
从 1 月 1 日起,中国将对白银出口实施许可证制度。这一点至关重要,因为中国是全球精炼白银的主要净出口国,每年出口约 1.21 亿盎司白银,几乎全部通过香港流向全球市场。
And now, this export flow requires government approval.
A strategic resource game is underway.
The premium on physical silver is astonishingly high.
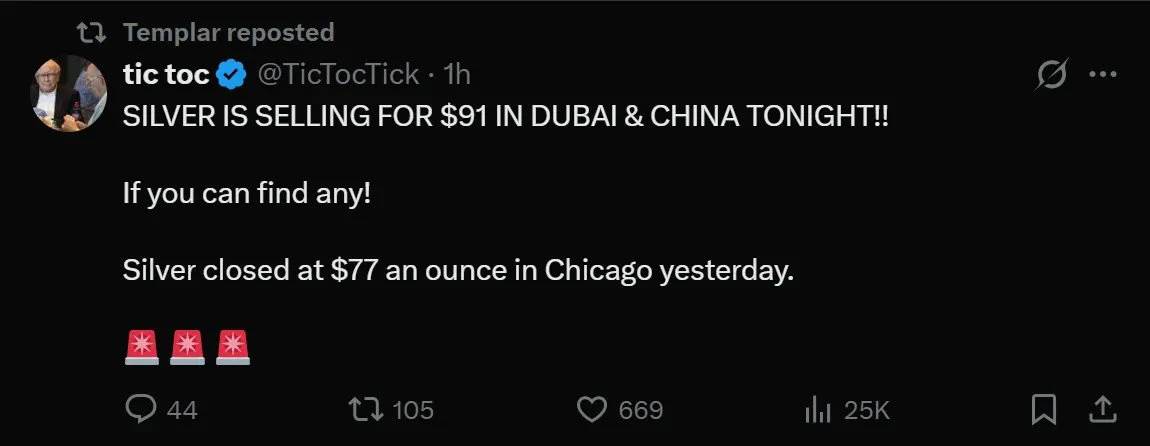
In Shanghai, the price is $85 per ounce; in Dubai, it’s $91 per ounce; at COMEX, it’s $77 per ounce.
You live in a world where prices are measured in dollars, but marginal buyers don’t face such constraints. They are willing to pay a premium of 10-14 dollars, and they don’t care about it at all.
When there’s such a big difference between the price of physical silver and its paper-based price, one of the parties must be wrong. Historically, it’s usually the physical market that makes mistakes.
The “craze” in the London market…
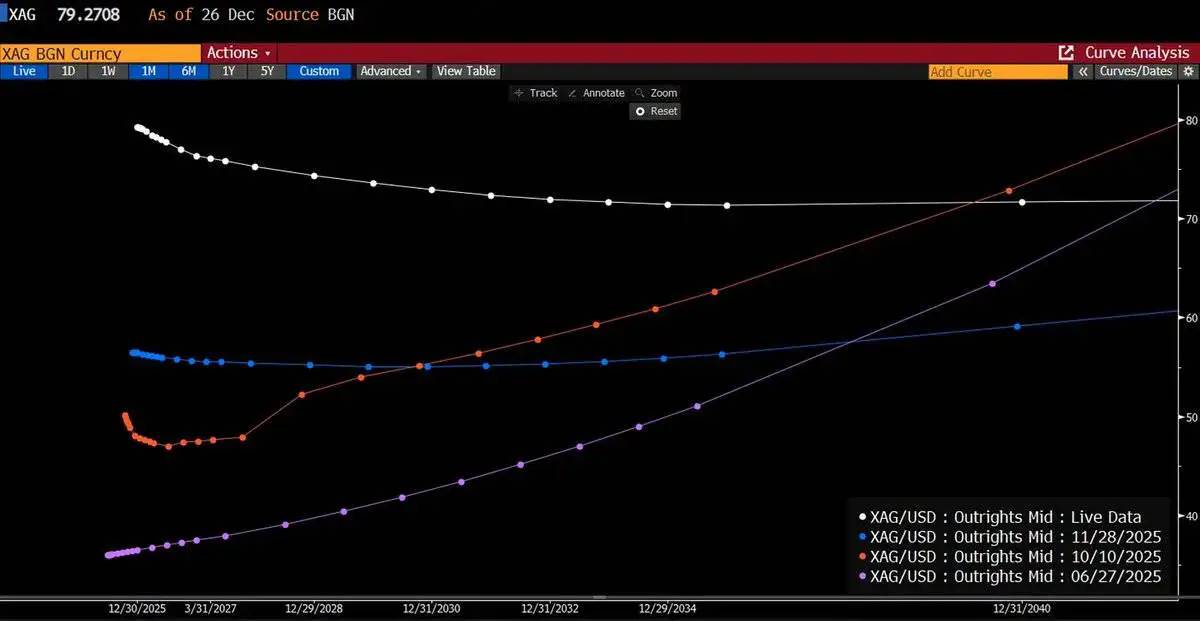
The over-the-counter market in London is the core place where physical silver is traded among gold and silver banks, refiners, and industrial users. Currently, this market is experiencing the worst backwardation situation in decades.
What is backwardation?
Simply put, it means that the market is willing to pay a higher price for today’s physical silver, rather than the promised price for future deliveries. In other words, the spot price > the forward price. This phenomenon is abnormal and usually indicates significant market pressure.
● One year ago: The spot price was $29, and the price curve gradually rose to $42. This is a normal contango situation.
● Now: The spot price is $80, but the price curve has dropped to $73, indicating an inverted situation.
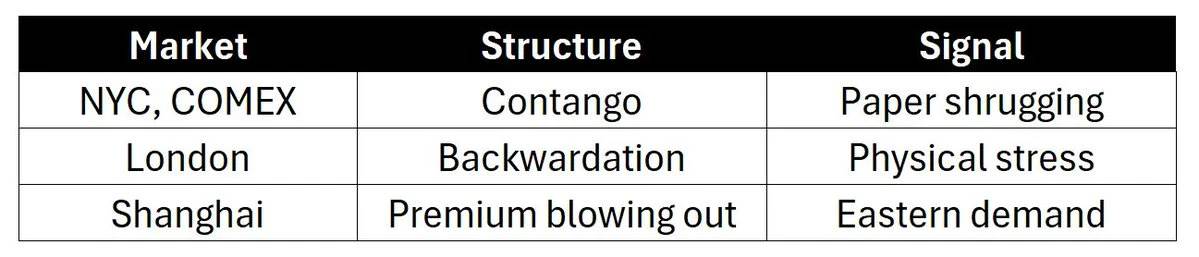
At the same time, the COMEX market still shows a normal-looking futures premium, as if everything is fine.
Three markets, three different narratives:
Volatility has been re-priced.
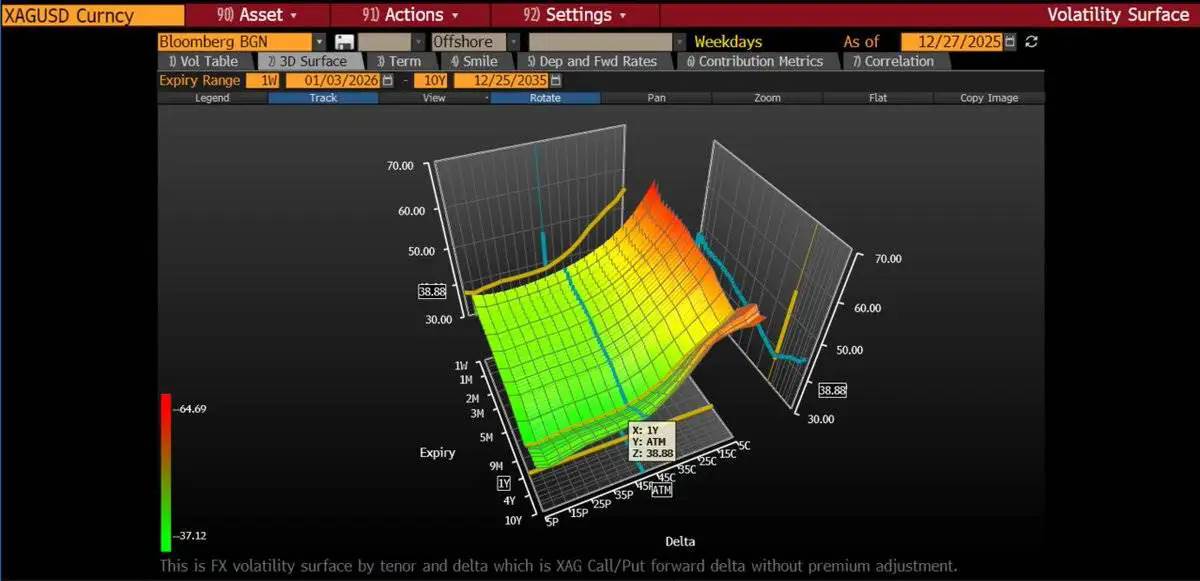
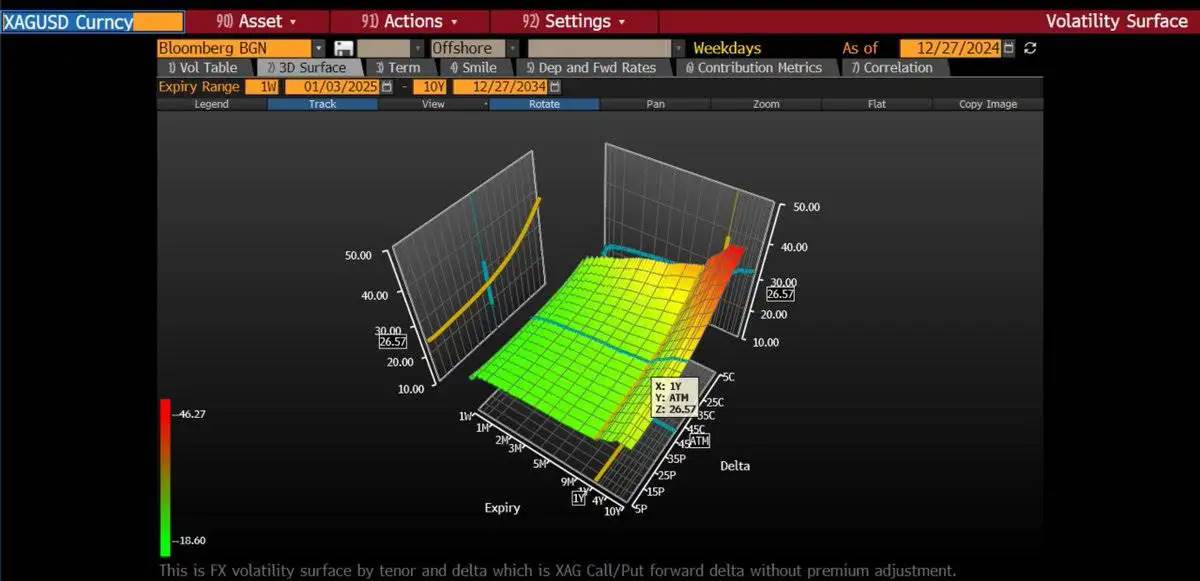
The implied volatility of at-the-money options has increased from 27% to 43%. The implied volatility of call options is even higher—the implied volatility of options with out-of-the-money strike prices can reach 50-70%. This indicates that the options market is pricing in the risk of significant price increases.
We are buying call spread options along the volatility curve. Our strategy involves buying options with at-the-money implied volatility, while simultaneously selling call options with high strike prices to hedge our costs. Recently, we even adopted a strategy involving buying butterfly options with a six-month term:
● Buying 1 call option on SLV(iShares Silver Trust ETF) with a strike price of $70;
● Selling 2 call options with a strike price of $90;
● Buying back 1 call option with a strike price of $110.
This strategy reflects our short-term approach: to reduce our Delta exposure when prices rise significantly.
Speculators have not yet flooded in.
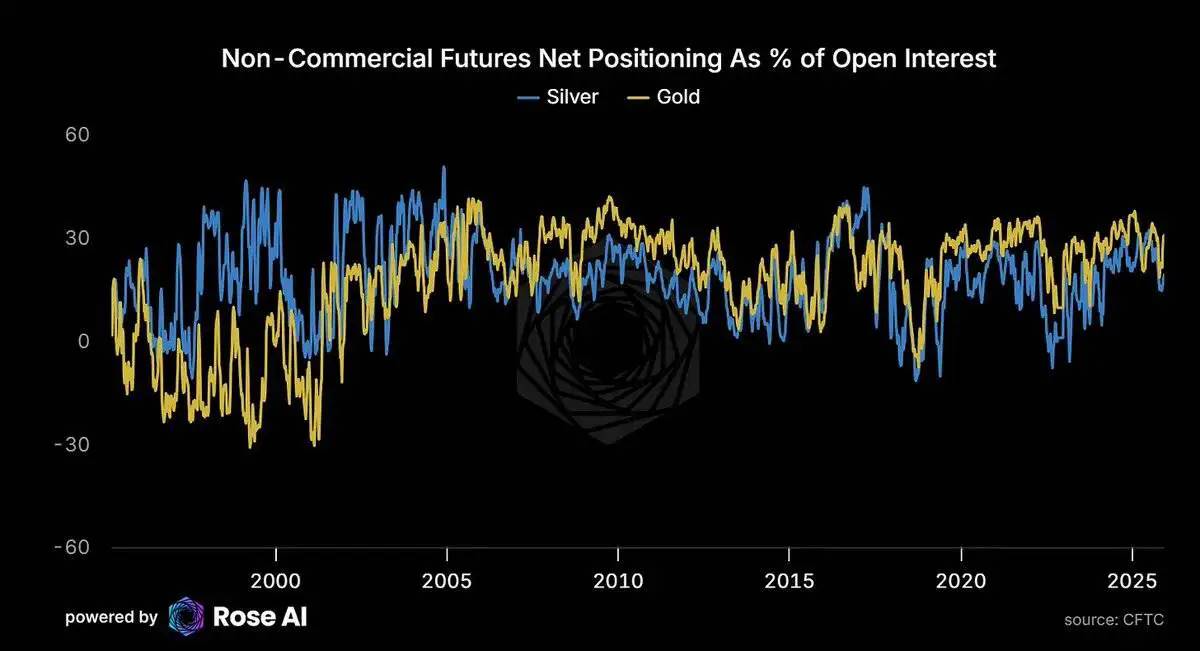
Currently, speculative long positions in the gold market account for 31% of all open contracts, while in the silver market this figure is only 19%. This indicates that although silver prices have risen, speculative positions have not reached extreme levels, and there is still room for further increases.
Demand for ETFs is catching up with
. Investment demand increases as prices rise, which confirms our previous prediction: silver will exhibit characteristics similar to Veblen Goods, meaning that higher prices lead to greater demand.
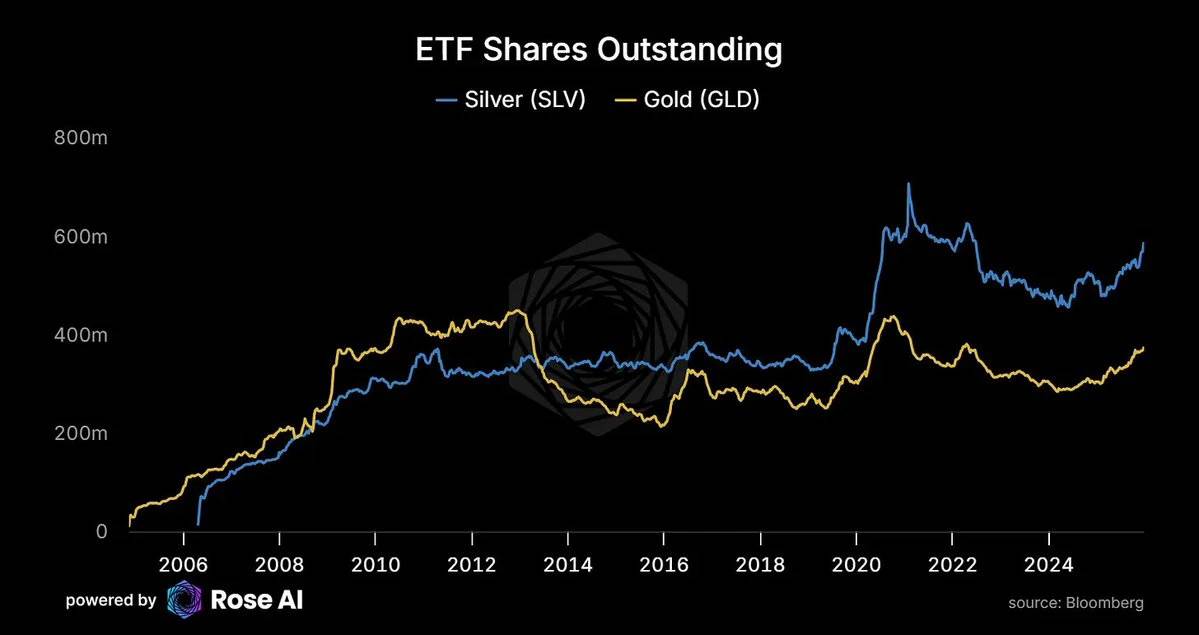
● After years of capital outflows, the number of shares outstanding in SLV ETFs is once again increasing. As prices rise, so does demand.
● This isn’t a typical behavior in commodity markets; rather, it reflects the growing demand for silver as a monetary asset.
At the same time, there remains a premium in the Chinese market for silver:
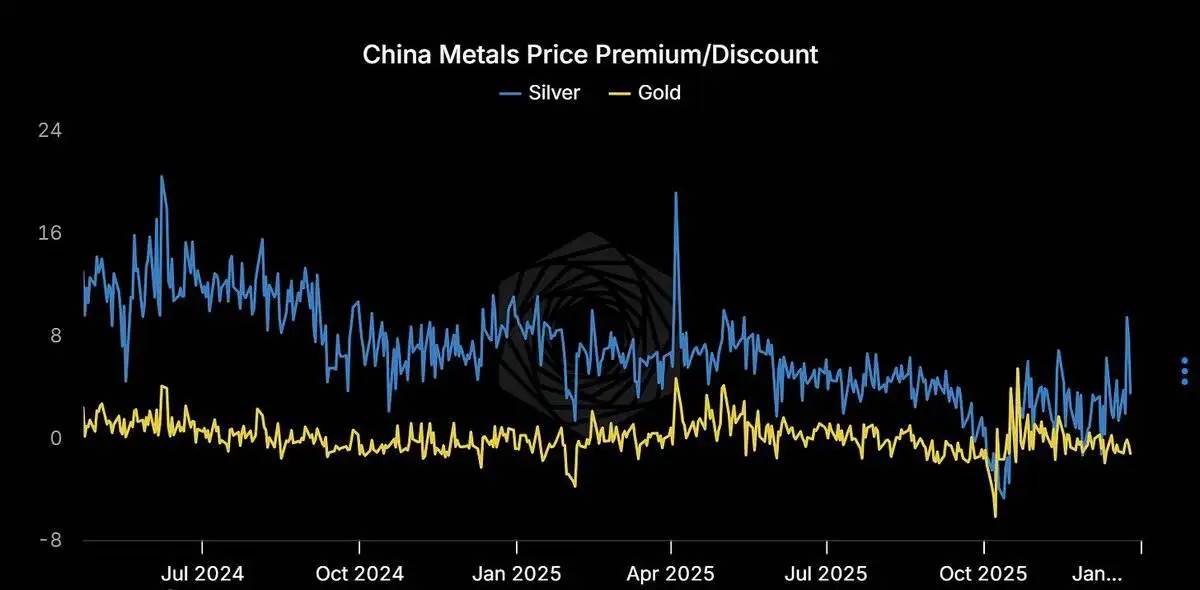
● Western ETFs are beginning to buy back silver again;
● Meanwhile, physical demand for silver in the Eastern market has never stopped.
The solar industry “consumes” more and more silver.
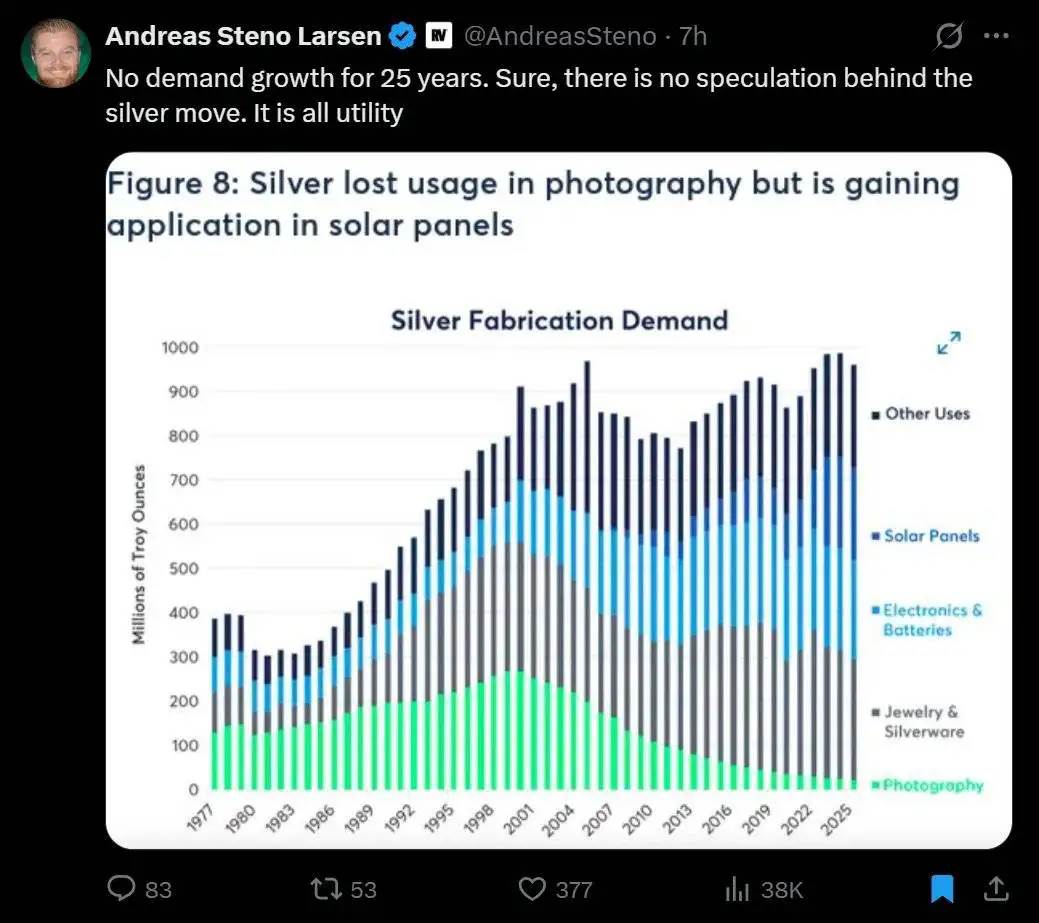
No growth in demand or supply over 25 years… until solar energy came along.
Over the past 25 years, demand for silver in the market has remained almost constant, with supply also not showing significant increases. However, everything changed with the rise of the solar energy industry. The need for silver in the photography industry gradually diminished, and the solar energy industry not only filled this void but also led to a dramatic increase in silver demand.
Currently, the solar energy industry consumes 290 million ounces of silver;
By 2030, this figure is expected to exceed 450 million ounces.
Artificial intelligence → Energy → Solar Power → Silver
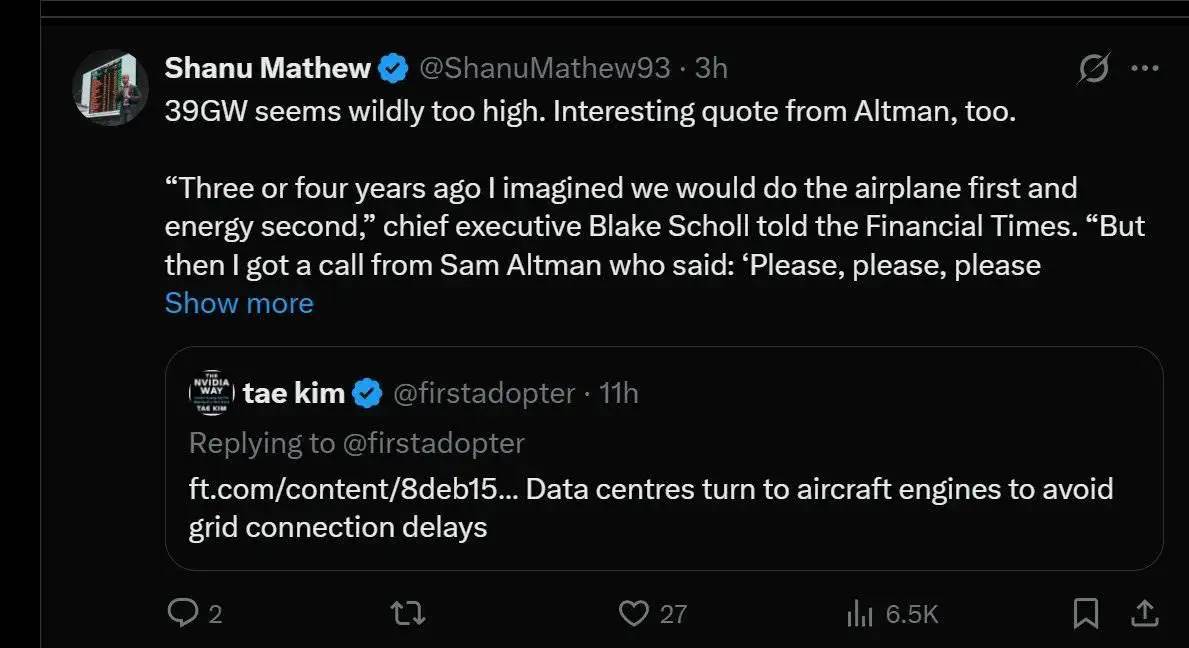
A chain of events has been formed: from artificial intelligence to silver demand.
Sam Altman (CEO of OpenAI) is actively contacting companies, seeking urgent solutions for power supply;
To avoid delays in connecting to the power grid, data centers are even starting to install aircraft engines as emergency power sources;
Every query processed by artificial intelligence consumes electricity, and the only source of additional power supply is solar energy;
And the development of solar energy depends on silver.
This chain is now complete.
Key prices and signals that need attention
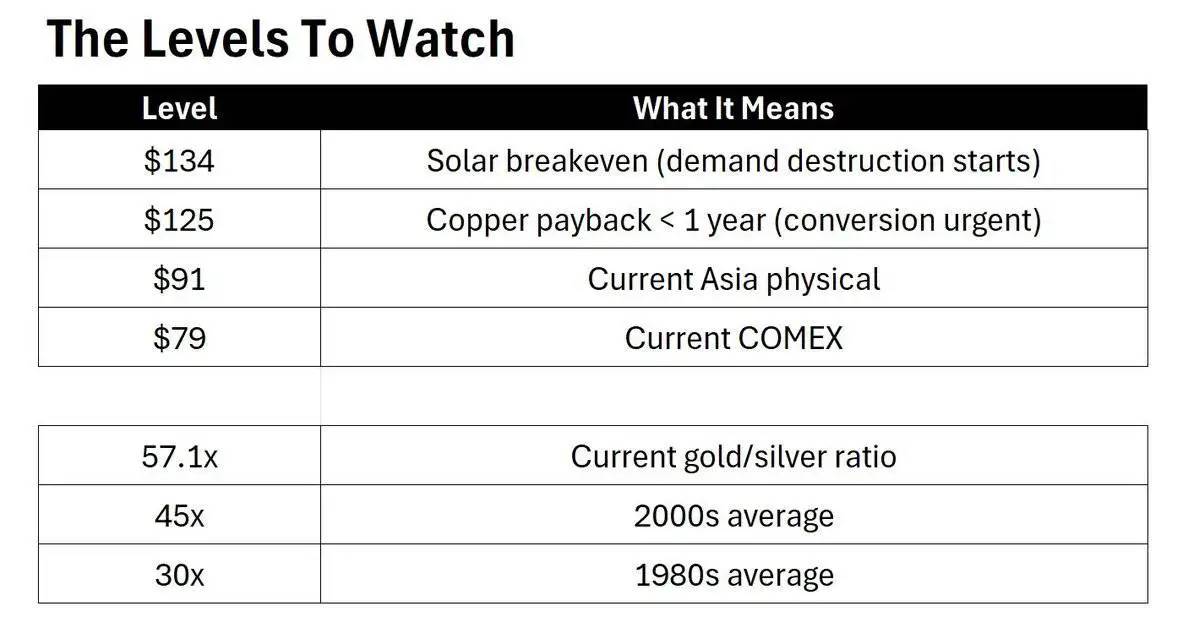
Risks that need attention
Tax sales in January: Investors may sell silver at the beginning of the year due to tax reasons, causing short-term fluctuations;
Strengthening of the US dollar: A strong US dollar could put pressure on the price of silver priced in dollars;
保证金上调:虽然“杀手开关”已经耗尽,但仍需警惕保证金的进一步上调。
需要关注的信号
1、现货溢价加深,价格横盘整理:表明市场正在积累;
2、现货溢价缓解,价格下跌:表明挤压行情正在解除;
3、上海市场溢价持续存在:表明这是结构性问题,而非市场噪音。
观察框架:
关注曲线,而非价格。
如果伦敦实物市场的压力持续,而 COMEX 纸面市场却无动于衷,那么套利空间将持续扩大,直到市场出现“断裂”:
1、要么供应突然增加(价格飙升以释放被囤积的白银);
2、要么纸面市场价格被迫重新调整至反映实物市场的真实情况。
最终总结
短期内,空头逻辑确实存在,以下因素可能对市场造成冲击:
● 税收抛售:年初的税务相关抛售可能带来短期波动;
● 保证金上调:潜在的保证金调整可能对市场情绪产生影响;
● 美元走强:美元升值可能对以美元计价的白银价格形成压力。
然而,支撑白银价格的长期结构性因素依然强劲:
1、伦敦市场现货溢价处于数十年来的极端水平;
2、亚洲市场溢价高达 10-14 美元;
3、中国将在 5 天内实施白银出口限制;
4、太阳能需求对白银价格的弹性极低,即使价格达到 134 美元/盎司,需求破坏才刚刚开始;
5、铜替代至少需要 4 年时间才能完成 50% 的转换;
6、72% 的白银供应是其他金属的副产品,无法通过简单增产来满足需求;
7、投机仓位并未过度拥挤,ETF 正在持续吸纳白银实物;
8、波动率已经重新定价,市场正在为价格大幅上涨的尾部风险定价。
这正是市场最有趣的地方,也是最令人感到恐惧的地方。
建议:根据以上信息调整仓位,理性投资。下次再见!