Exchange Ranking
 Top Exchanges
 24h Volume Ranking
 Popularity Ranking
 Exchange BTC Balance
 Proof of Reserves
 Decentralized Exchanges
 Funding Rate
 Funding Heatmap
 Liquidation Data
 Max Pain
 Long/Short Ratio
 Whale L/S Ratio
 Binance/Okex/Huobi L/S
 Bitfinex Margin L/S
 ETF Tracker
 Solana ETF
 XRP ETF
 Hong Kong ETF
 Bitcoin Treasuries
 Crypto Reversal
 Ethereum Reserves
 HyperLiquid Wallet Analysis
 Hyperliquid Whale Watch
 Large Transactions
 On-chain Movement
 Bitcoin ROI
 Stablecoin Market Cap
 Options Analysis
 News
 Articles
 Economic Calendar
 Features
 Wallet
 Contract Calculator


 Security
 Collections
 Watchlist
 Following
 BTC
12月19日,美元指数在技术面上释放出一个不容忽视的信号:在长期趋势偏弱的情况下,日线级别罕见走出“黄金交叉”,这是自1970年以来仅出现过16次的特殊形态。历史经验显示,这类金叉往往意味着美元将在随后数月阶段性走强,并对风险资产形成压制。在美联储降息预期反复、加密市场年末震荡的当下,这一信号不仅牵动美股与大宗商品,也为比特币和全球资金流向在2026年初的走向埋下了关键伏笔。
一、第39次“黄金交叉”显现
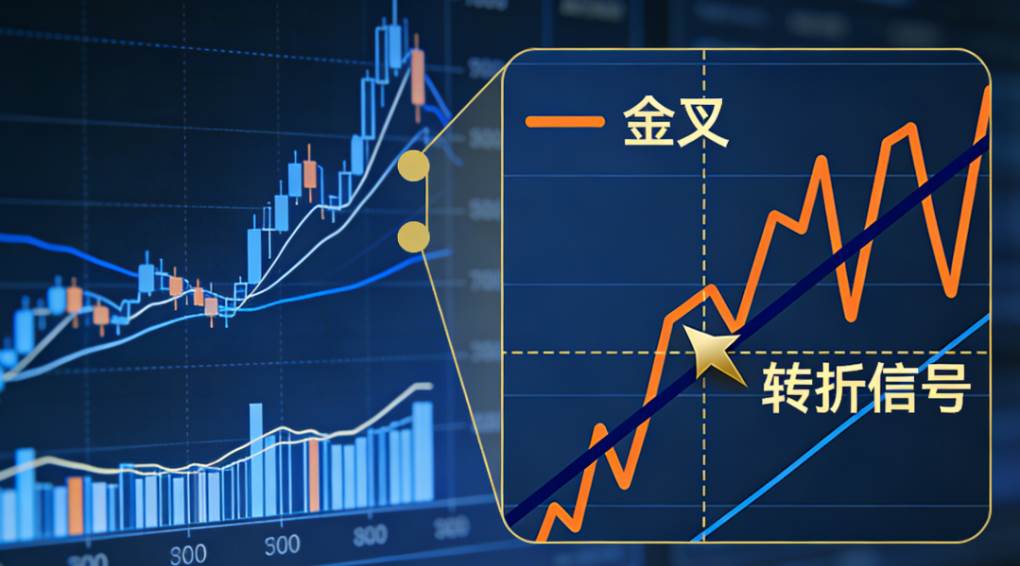
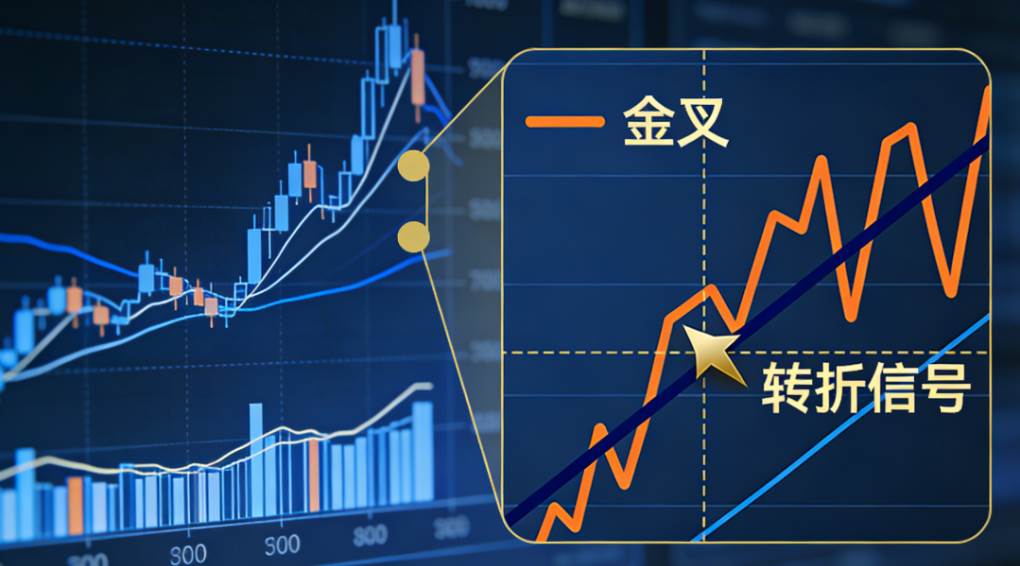
美元指数在2025年12月19日收盘后,其技术图表上触发了市场密切关注的技术信号:50日移动平均线上穿200日移动平均线,形成了被称为“黄金交叉”(Golden Cross)的看涨形态。
● 信号本质:这一信号被认为是市场中期的趋势转向指标,其根本逻辑在于,短期均线上穿长期均线,意味着近期市场平均成本的上升速度超过了长期成本,暗示买盘力量正在聚集,趋势可能由弱转强。
● 历史统计意义:根据美银美林技术策略团队的统计,自1970年以来,这是美元指数第39次出现“黄金交叉”信号。
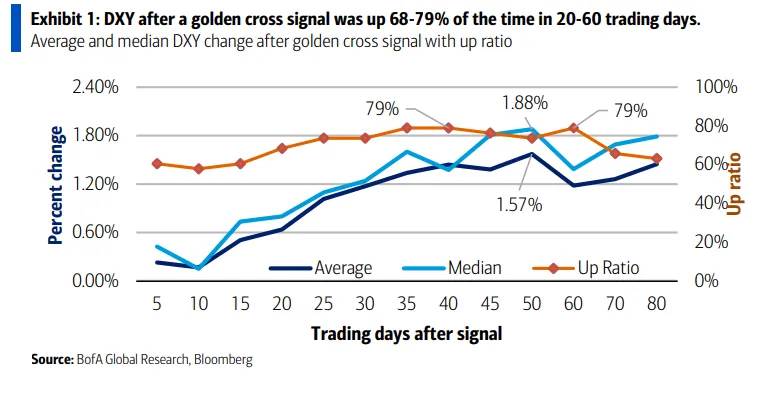
Historical backtests indicate that the appearance of this signal is not merely random noise. Within 20 to 60 trading days (approximately 1 to 3 months) after the signal appears, there is a 68% to 79% probability that the US dollar index will rise. Specifically, the highest probability of an increase occurs during the 35-40 trading days and 60 trading days after the signal appears, reaching 79%. During this period, the average increase in the US dollar index was approximately 1.22%, and the median increase was even higher, at around 1.40%. This statistical pattern provides historical support for the potential technical rebound of the US dollar in the first quarter of 2026. Of course, markets often experience seasonal downturns at the end of the year.
Second, the “weak golden cross” in a downward trend
The reason why this “golden cross” has attracted so much attention is not only due to the signal itself, but also because of the unique market conditions in which it occurred.
● Rare technical context: When this golden cross occurred, not only did the short-term moving averages cross above each other, but more importantly, the 200-day moving average itself was also in a downward trend. This is defined as a “very rare occurrence” – it’s the 16th time since 1970 that a golden cross has occurred when the 200-day moving average is below zero.
● Stronger historical evidence: In such special circumstances, this signal has shown a stronger performance than ordinary golden crosses. Data shows that when a golden cross occurs along with a downward trend in the 200-day moving average, there is an 80% probability that the US dollar index will rise within the next 15, 25, 35, and 60 trading days (or 12 out of 15 times in history).
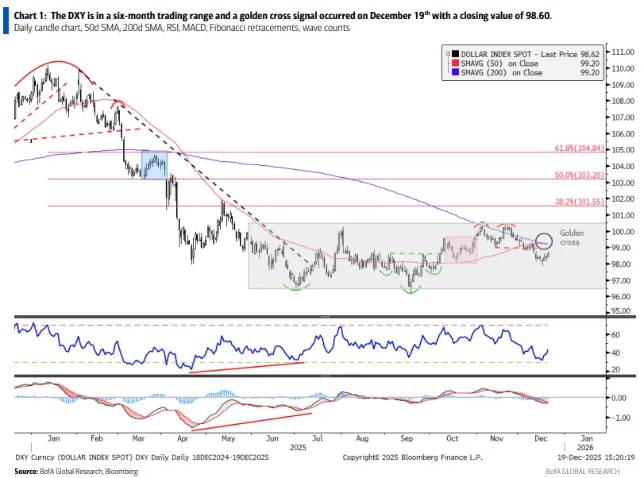
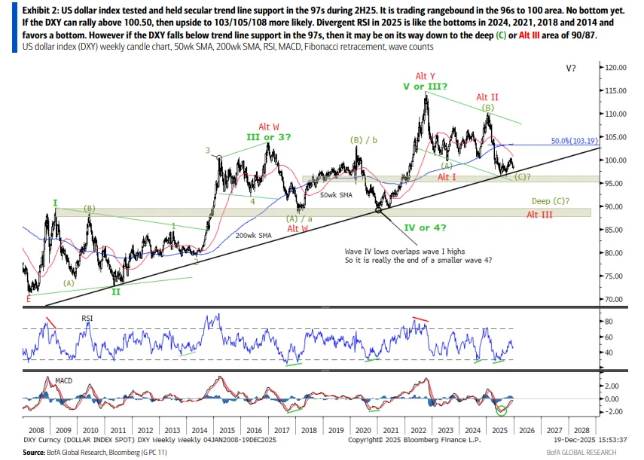
● Historical context and risks: The last time a similar double bottom pattern appeared below the moving averages was in 2004. At that time, the US dollar index experienced approximately six months of sideways movement, with market volatility increasing significantly. This led to the occurrence of both the golden cross and the reverse “death cross” patterns in the short term. This suggests that while the current signals indicate a high probability of an upward trend, it does not necessarily mean that the market will move smoothly in one direction. There is still a possibility of market fluctuations. Analysis also indicates that the current US dollar index is testing the support of a key long-term trend line at around 97. If this level is broken, it could lead to further declines towards 90/87.
Third, the impact on stocks, crude oil, and other assets
As the global asset price benchmark, changes in the technical trends of the US dollar often have spillover effects, affecting the performance of other major asset classes. Historical data reveals the following correlations:
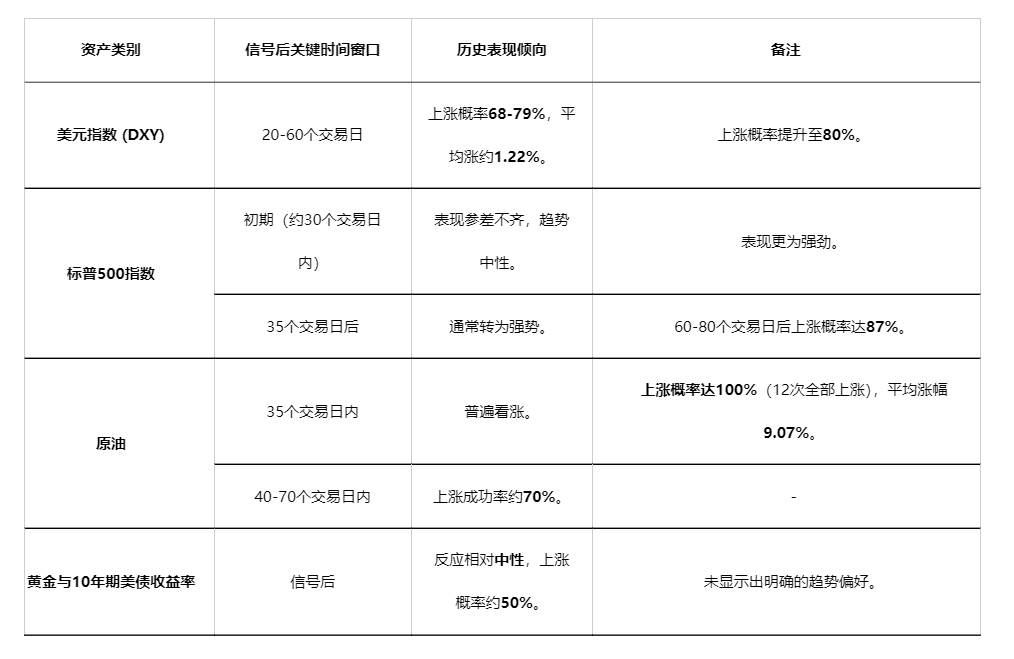
As can be seen from the table above:
● Crude oil is the asset that reacts most strongly, especially after the appearance of this particular type of golden cross. The historical probability of an increase in crude oil prices is 100%, indicating a strong positive correlation.
● Stocks have a delayed response: The S&P 500 index does not immediately follow the trend, but instead tends to strengthen after more than a month. This may reflect the market’s process of digesting the initial impacts of a stronger US dollar.
● Diversification of safe-haven assets: Gold and U.S. Treasury bond yields did not show a clear direction, suggesting that traditional safe-haven assets may face complex competition between bulls and bears given the expectation of a strengthening US dollar.
Fourth, the intersection of technical signals and macro realities
Although historical technical indicators suggest a bullish trend, the current fundamentals of the US dollar are complex, and there are differing opinions among market institutions. Investors need to consider these factors carefully.
● Technical support: In addition to Bank of America and Merrill Lynch, other institutions have also noted positive changes in the technical outlook of the US dollar. DBS Bank stated in its report from December 2025 that the US Dollar Index has been in a sideways range between 96.50 and 100.30 since June 2025. This could be seen as an “extended bottom,” and they believe that the technical outlook for the US dollar has turned positive. They pointed out that if the US Dollar Index can break through the key resistance level of 100.26, it could further rise to the range of 101.55-101.98.
● Macroeconomic constraints: Many macroeconomic analysts point out that the US dollar faces structural pressures. Goldman Sachs suggested in its report from mid-2025 that due to uncertainties in U.S. policy, global capital diversification trends, and fiscal concerns, the US dollar’s “safe-haven status” has diminished significantly. Instead, it has become more of a “risky currency.” The weakening trend is likely to continue. UBS also predicted that in the fourth quarter of 2025, the US dollar will continue to weaken due to expectations of interest rate cuts in the U.S. and weak labor markets.
● A rational approach to technical signals:There is market experience to suggest that no technical indicator can be considered a “perfectionist tool.” Moving averages, in essence, are lagging indicators. The signal of a golden cross often serves as confirmation of an existing trend shift, rather than a precise forecast. Investors should avoid blindly following a single signal and instead make judgments based on a broader range of fundamental factors.
Fifthly, the game of playing during key trading periods
In summary, the rare “golden cross” that occurred in the US dollar index at the end of 2025 undoubtedly introduced new variables into the market.
● The core message of this signal: The core value of this signal lies in its probabilistic indication that there is a increased likelihood of a technical rebound for the US dollar during the first quarter of 2026 (within the next 20-60 trading days). This is especially true considering that this golden cross occurs within a “weakness context” where historical success rates are higher.
● The interplay between bullish and bearish factors: However, the ultimate direction of the US dollar will be determined by the competition between technical and fundamental forces. The technical momentum provided by the market may clash with fundamental factors such as the Fed’s policy decisions regarding interest rate cuts, the growth gap between the United States and non-US economies, as well as global geopolitical risks.
● Implications for investors: For market participants, this signal is particularly important because it indicates potential directions of asset allocation shifts. Historical patterns suggest that if the US dollar continues to strengthen, crude oil and US stocks, which are relatively late to react to changes in the dollar’s value, could become attractive assets for investors to consider. At the same time, investors should pay close attention to any breaks in the US dollar index at key support levels around 97 or resistance levels around 100.26. These points will be crucial in determining whether a technical rebound can occur successfully.