Exchange Ranking
 Top Exchanges
 24h Volume Ranking
 Popularity Ranking
 Exchange BTC Balance
 Proof of Reserves
 Decentralized Exchanges
 Funding Rate
 Funding Heatmap
 Liquidation Data
 Max Pain
 Long/Short Ratio
 Whale L/S Ratio
 Binance/Okex/Huobi L/S
 Bitfinex Margin L/S
 ETF Tracker
 Solana ETF
 XRP ETF
 Hong Kong ETF
 Bitcoin Treasuries
 Crypto Reversal
 Ethereum Reserves
 HyperLiquid Wallet Analysis
 Hyperliquid Whale Watch
 Large Transactions
 On-chain Movement
 Bitcoin ROI
 Stablecoin Market Cap
 Options Analysis
 News
 Articles
 Economic Calendar
 Features
 Wallet
 Contract Calculator


 Security
 Collections
 Watchlist
 Following
 BTC
Looking back at previous Bitcoin bull markets, it’s common for prices to reach peaks accompanied by signs of overheating. However, this cycle seems particularly unusual: many well-established indicators that have been proven accurate over time failed to signal a peak. Additionally, Bitcoin continued to decline after reaching new highs in early October, and indicators related to on-chain data and sentiment further fueled bearish expectations. The discrepancy between indicators and price movements, combined with recent market signals such as changes in funds flowing into spot ETFs and behavior among long-term investors, has led to confusion among market participants regarding the direction of the market. This has prompted us to reevaluate whether these traditional indicators still apply to today’s cryptocurrency market.
1. Pi Cycle Top Indicator: Does it reach the peak of the cycle?
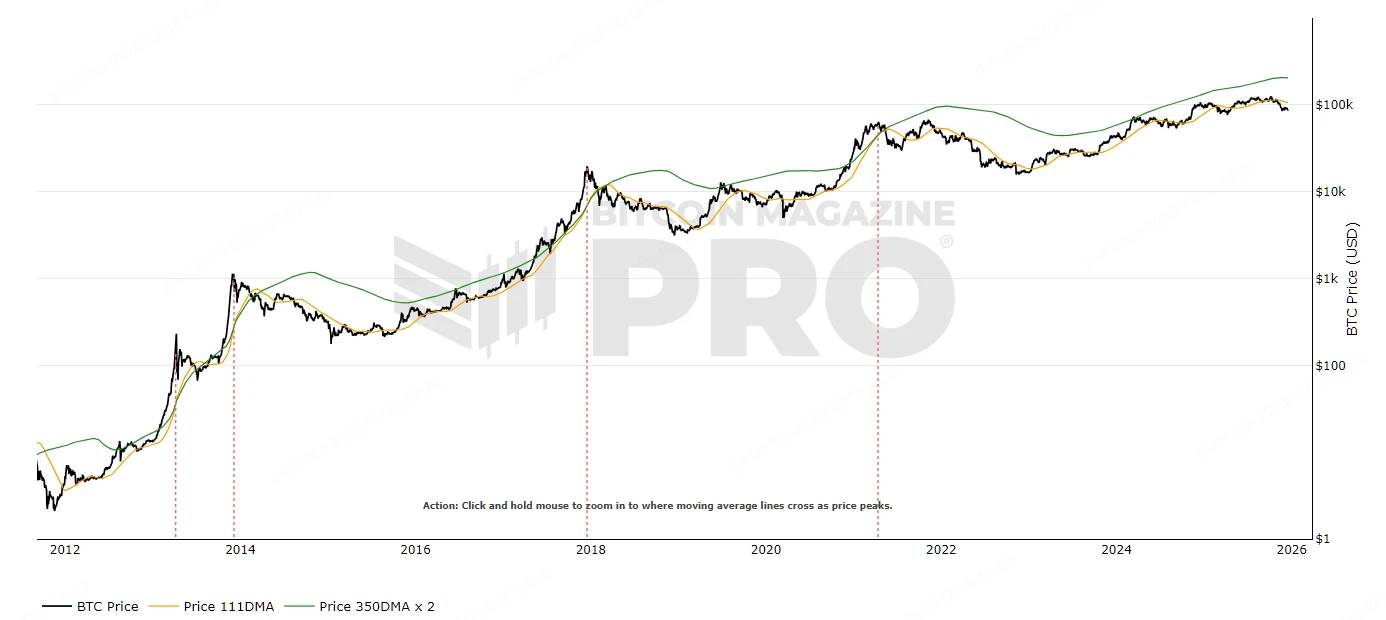
The PI cycle indicator is a classic tool used to identify potential price peaks, based on the 111-day moving average (111DMA) and the 350-day moving average multiplied by 2 (350DMA x 2).
Generally, when the short-term line crosses above the long-term line, it indicates a market peak, as this suggests that prices are rising too quickly and are no longer supported by fundamental factors.
Historically, the Pi Cycle Top Indicator has shown cross-signals before each bull market peak.
● In 2017, the 111DMA crossed above the 350DMA x 2, indicating that the bubble eventually burst.
● In 2021, after a similar crossing, a peak appeared first, followed by a rapid correction in prices.
Currently (Q4 2025), as shown in the chart below, the two lines have not yet crossed.
Source: https://www.bitcoinmagazinepro.com/charts/pi-cycle-top-indicator
2. Puell Multiple: Is the profit margin of miners excessive?
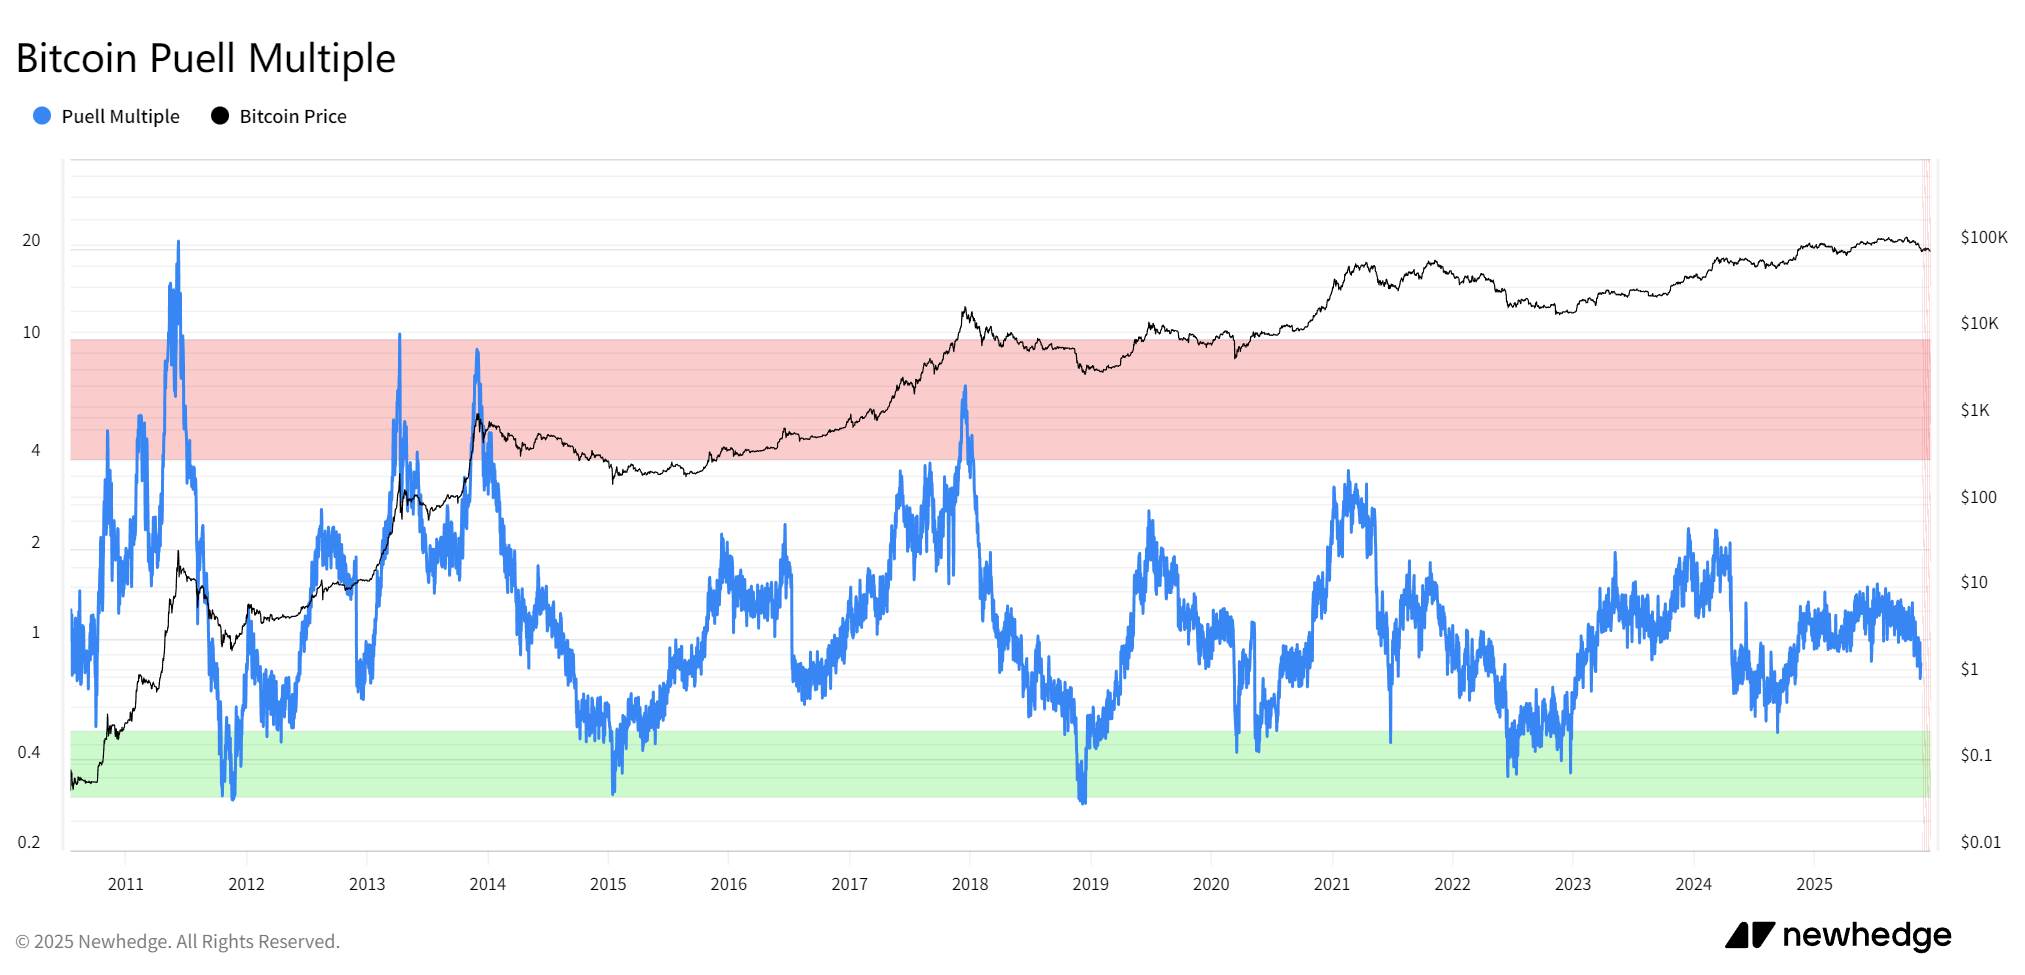
The Puell Multiple measures the ratio of a miner’s daily income to the 365-day moving average. This indicator is used to assess the profitability of miners and the market cycle.
Its mechanism is based on miner behavior: when the ratio is high, miners earn substantial profits, which may lead to selling pressure and form a “top” in the market; when the ratio is low, it indicates that miners are capitulating, signaling a potential bottom. In other words, a high Puell Multiple indicates that miners are making too much money, leading to increased supply pressure.
Historically, the Puell Multiple has experienced extreme spikes just before each bull market peak:
● In 2017, the Puell Multiple exceeded 7, marking a historical high;
● In 2021, the Puell Multiple exceeded 3, followed by a market collapse;
Currently (Q4 2025), the Puell Multiple is between 1 and 2, indicating moderate miner pressure.
Source: https://newhedge.io/bitcoin/puell-multiple
3. Bitcoin Rainbow Chart: Is the price entering the “sell” zone?
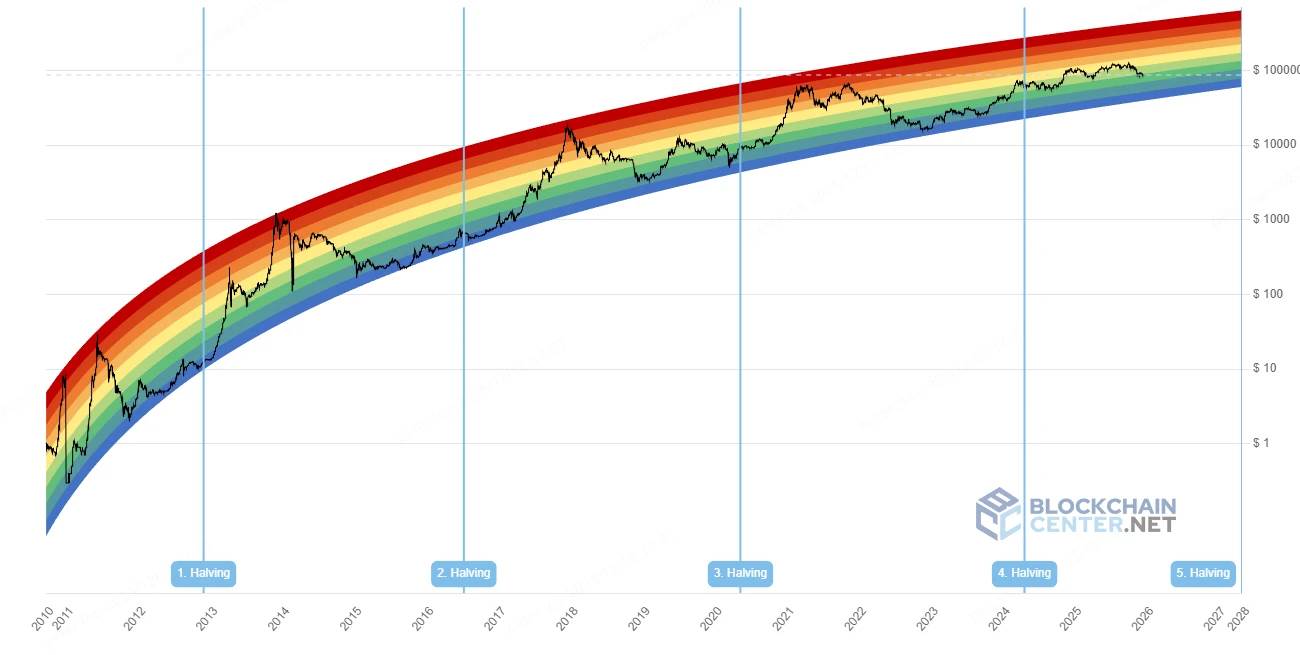
The Bitcoin Rainbow Chart uses logarithmic growth curves superimposed on rainbow-colored bands to assess the long-term valuation of Bitcoin.
Its mechanism involves mapping prices onto color bands: blue areas indicate undervaluation (buy), while red areas indicate overvaluation (sell). These color bands are based on historical growth patterns, helping to identify extreme market sentiment.
Historically, the Bitcoin Rainbow Chart has shown signs of entering the red zone just before each bull market peak:
● In 2017, the Bitcoin Rainbow Chart entered the deep red zone, indicating a bubble peak;
● In 2021, there was a double top: the price remained in the orange-red zone, and later adjusted accordingly.
Currently (in Q4 2025), the price is within the yellow to orange range, and has not yet reached the red bubble area. We have seen many analysts adjusting this indicator, but regardless of the adjustments made, for now, the coin price has not reached the red bubble region observed in past historical data.
Source: https://www.blockchaincenter.net/en/bitcoin-rainbow-chart/
4. 2-Year Moving Average Multiplier: Has the multiplier reached its peak?
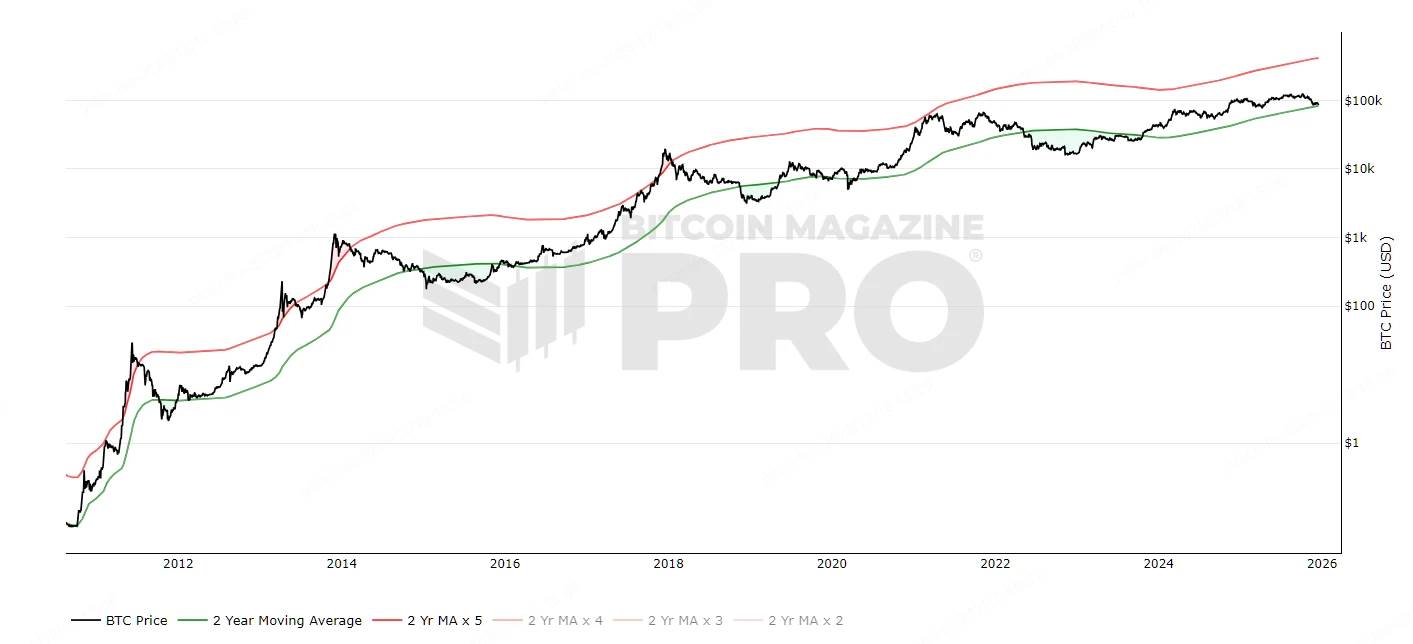
The 2-Year Moving Average Multiplier, also known as the Golden Ratio Multiplier, identifies resistance levels by multiplying the 2-year moving average by Fibonacci ratios.
Its principle involves combining the Golden Ratio (1.6) with Fibonacci sequences to assess the price relative to the long-term average. A high multiplier indicates overheating, suggesting a correction. In other words, a high multiplier means that the price “deviates too far from the long-term trend,” indicating risk accumulation.
Historically, the 2-Year Moving Average Multiplier has shown extreme values before each bull market’s peak.
● In 2017, the multiplier reached 10 times higher than the actual coin price. The price reached its peak one month after crossing the 2-Year Moving Average * 5.
● In 2021, there was another double top, with a multiplier of more than 5 times higher than the actual coin price. The price reached its first peak just after touching the 2-Year Moving Average * 5.
Currently (in Q4 2025), the multiplier is between 2 and 3 times higher than the actual coin price, and has not yet reached the high multiplier range.
Source: https://www.bitcoinmagazinepro.com/charts/bitcoin-investor-tool/
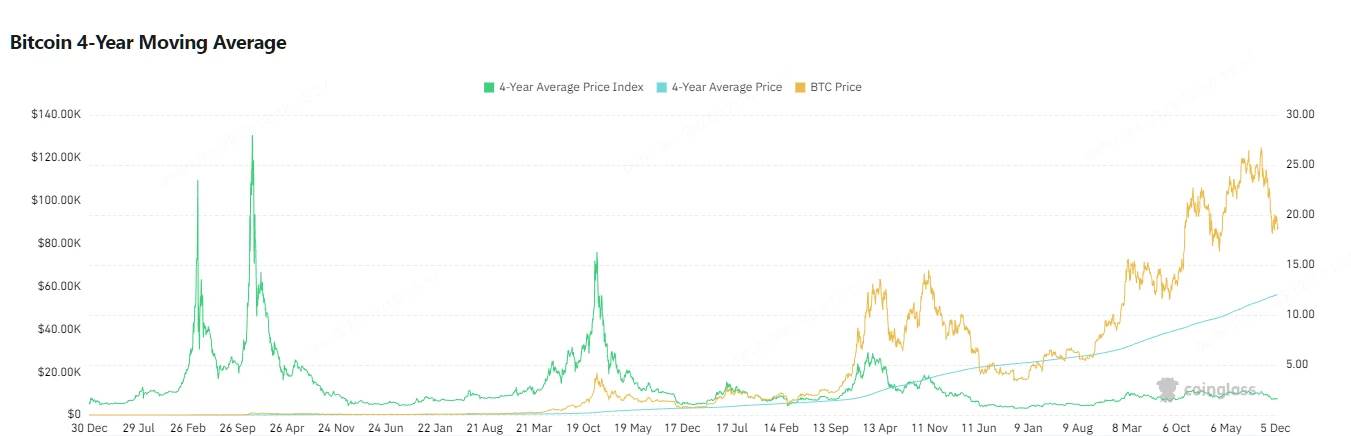
5、Bitcoin 4-Year Moving Average:价格是否远超长期均线?
Bitcoin 4-Year Moving Average计算4年价格平均,评估比特币币的宏观趋势。
它的原理平滑周期波动:价格远超均线表示过热;贴近均线表示均衡。换句话说,偏离过大意味着“周期性泡沫”,风险积累。
历史上,Bitcoin 4-Year Moving Average在每轮牛市顶部前都有价格极端偏离的表现:
● 2017年顶部:该指标达到16;
● 2021年双顶:第一个顶部时达到6,随后崩盘;
而当前(2025年Q4),价格最高达到2.3,呈现出峰值递减的特点。
Source:https://www.coinglass.com/pro/i/four-year-moving-average
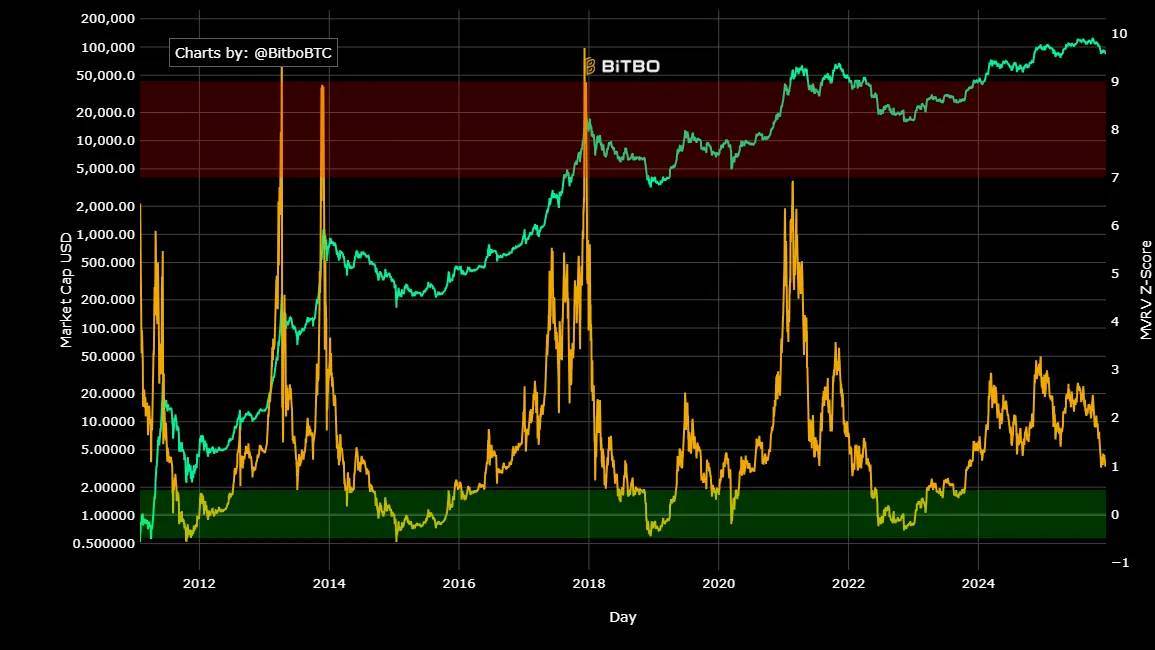
6、Bitcoin MVRV Z-Score:估值是否已进入风险区?
MVRV Z-Score是链上判断比特币估值是否“偏离其真实价值”的经典指标。
它的原理是将比特币当前市值与“实现市值”(即所有币的持仓成本总和)进行比较,然后计算其标准差偏离程度。换句话说:Z-Score越高,意味着多数人都处于浮盈状态,市场“太赚钱”,风险开始积累。
历史上,MVRV Z-Score在每轮牛市顶部前都有极端飙升的表现:
● In 2017, the peak value approached 10, reaching a historical high;
● In 2021, there was a double top, with the first peak exceeding 7, followed by a market crash;
Currently (in Q4 2025), the Z-Score is between 2 and 4, indicating that valuations remain neutral.
Source: https://charts.bitbo.io/mvrv-z-score
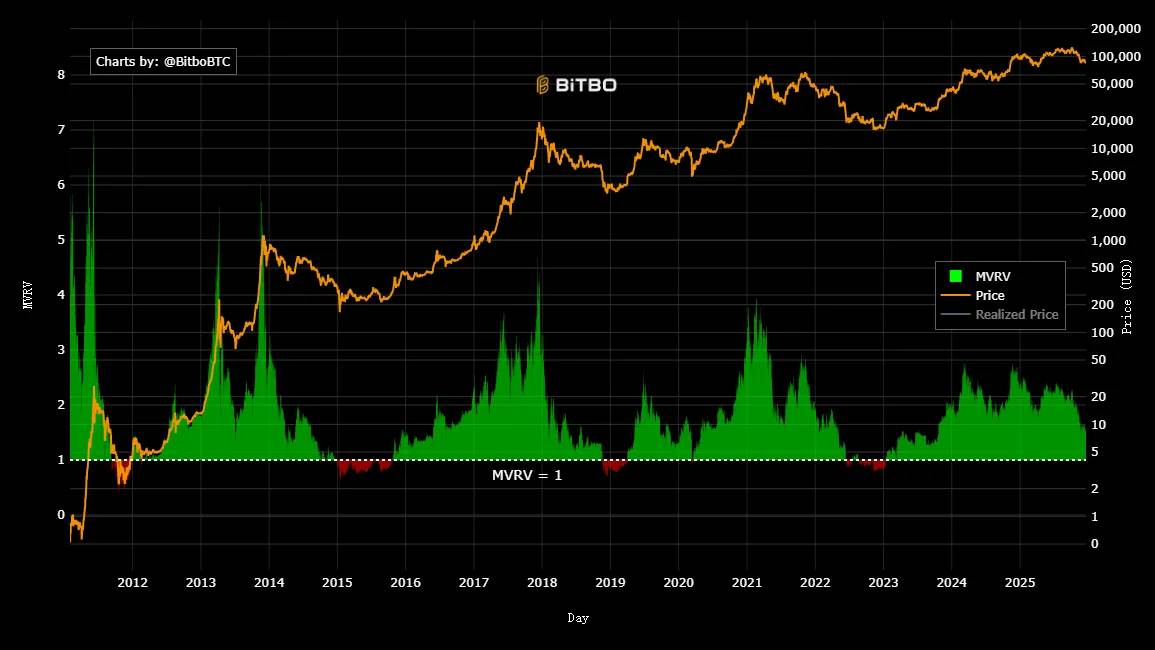
It’s worth noting that the MVRV Rate incorporates statistical analysis into the MVRV metric, measuring the standard deviation between the current MVRV and historical averages. This standardization helps identify when the trading price of Bitcoin exceeds or falls below its “fair value”. However, as shown in the chart below, this value decreases at the peak of each bull market, and sometimes even deviates from the peak price. This makes it more difficult to use this indicator to predict market peaks.
Source: https://charts.bitbo.io/mvrv
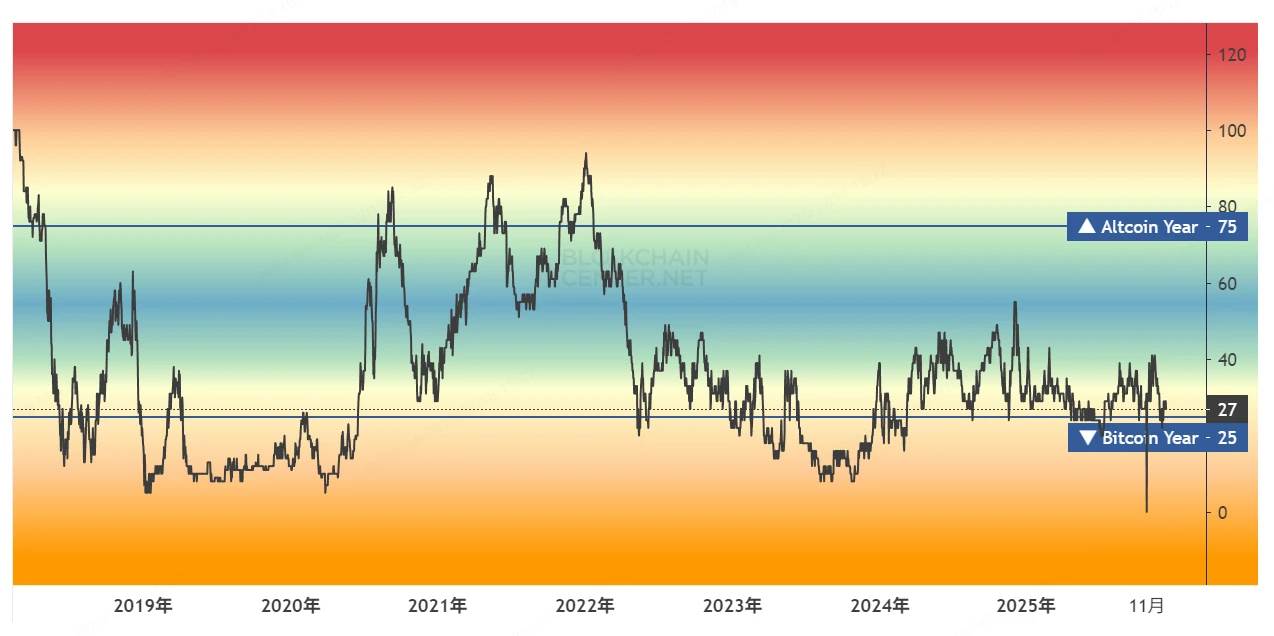
7. Altcoin Season Index: Has the altcoin season begun?
The Altcoin Season Index tracks the performance of the top 100 altcoins relative to Bitcoin, to determine whether the “altcoin season” has begun.
Its principle is based on relative performance: an index above 75 indicates that the altcoin season has begun. This usually occurs after the peak of the BTC market, as funds flow from BTC to altcoins. In other words, a high index means that BTC’s dominance is decreasing, and the market is diversifying risks.
Historically, every bull market peak has been marked by a frenzy of altcoins.
● In 2017, the peak value exceeded 90, marking the beginning of the altcoin season;
● 2021年双顶:超过80,随后BTC回调;
而当前(2025年Q4),指数处于30~40区间,山寨板块表现低迷。其实本轮BTC牛市以来,该指标最高都没有触及60,这可能是因为流动性不足以及过多增发的新币造成的。
Source:https://www.blockchaincenter.net/en/altcoin-season-index
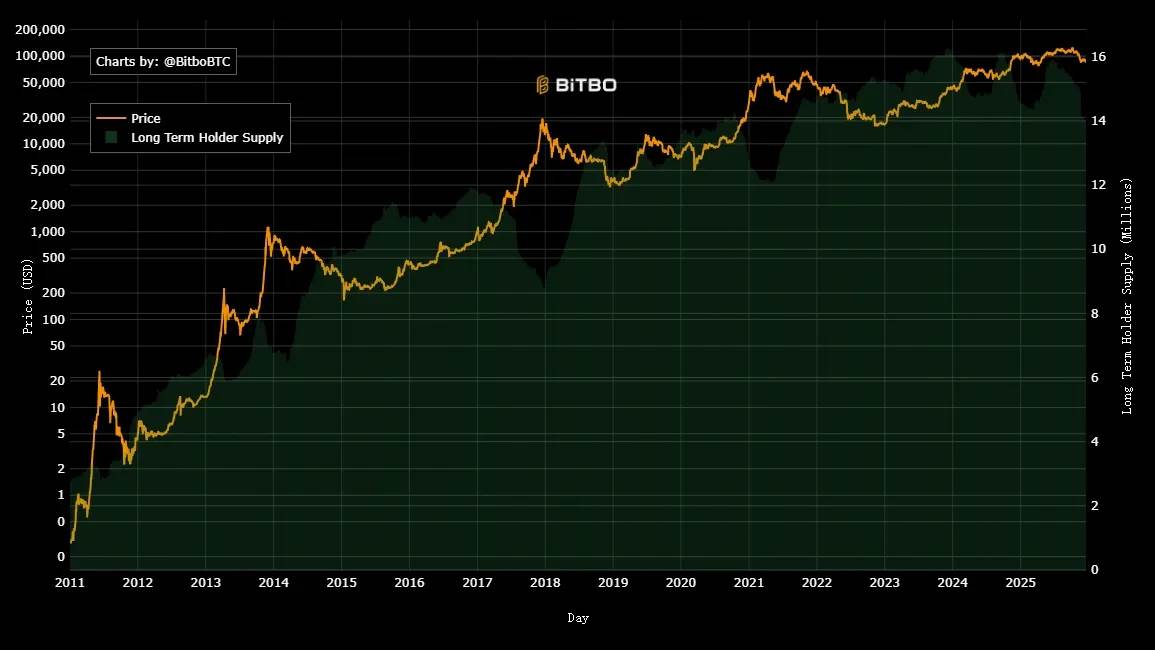
8、Bitcoin Long Term Holder Supply(LTH):长期持有者供应是否减少?
Bitcoin Long Term Holder Supply(LTH)追踪持有超过155天的比特币供应量,反映HODLer行为。
它的原理是观察供应变化:顶部时,LTH往往抛售,实现盈利;底部时积累。换句话说,LTH供应减少意味着“聪明钱”离场,风险高。
历史上,LTH在每轮牛市顶部前也都有显著减少的表现:
● 2017年顶部:抛售期长达一年,至顶部时达到抛售顶峰;
● 2021年双顶:第一个顶部遵循了持续抛售达半年的走势,但第二个顶部的累积量创了历史新高;
而当前(2025年Q4),缓慢抛售已有半年,但与10月份的顶部并不符合历史经验。
Source:https://charts.bitbo.io/long-term-holder-supply
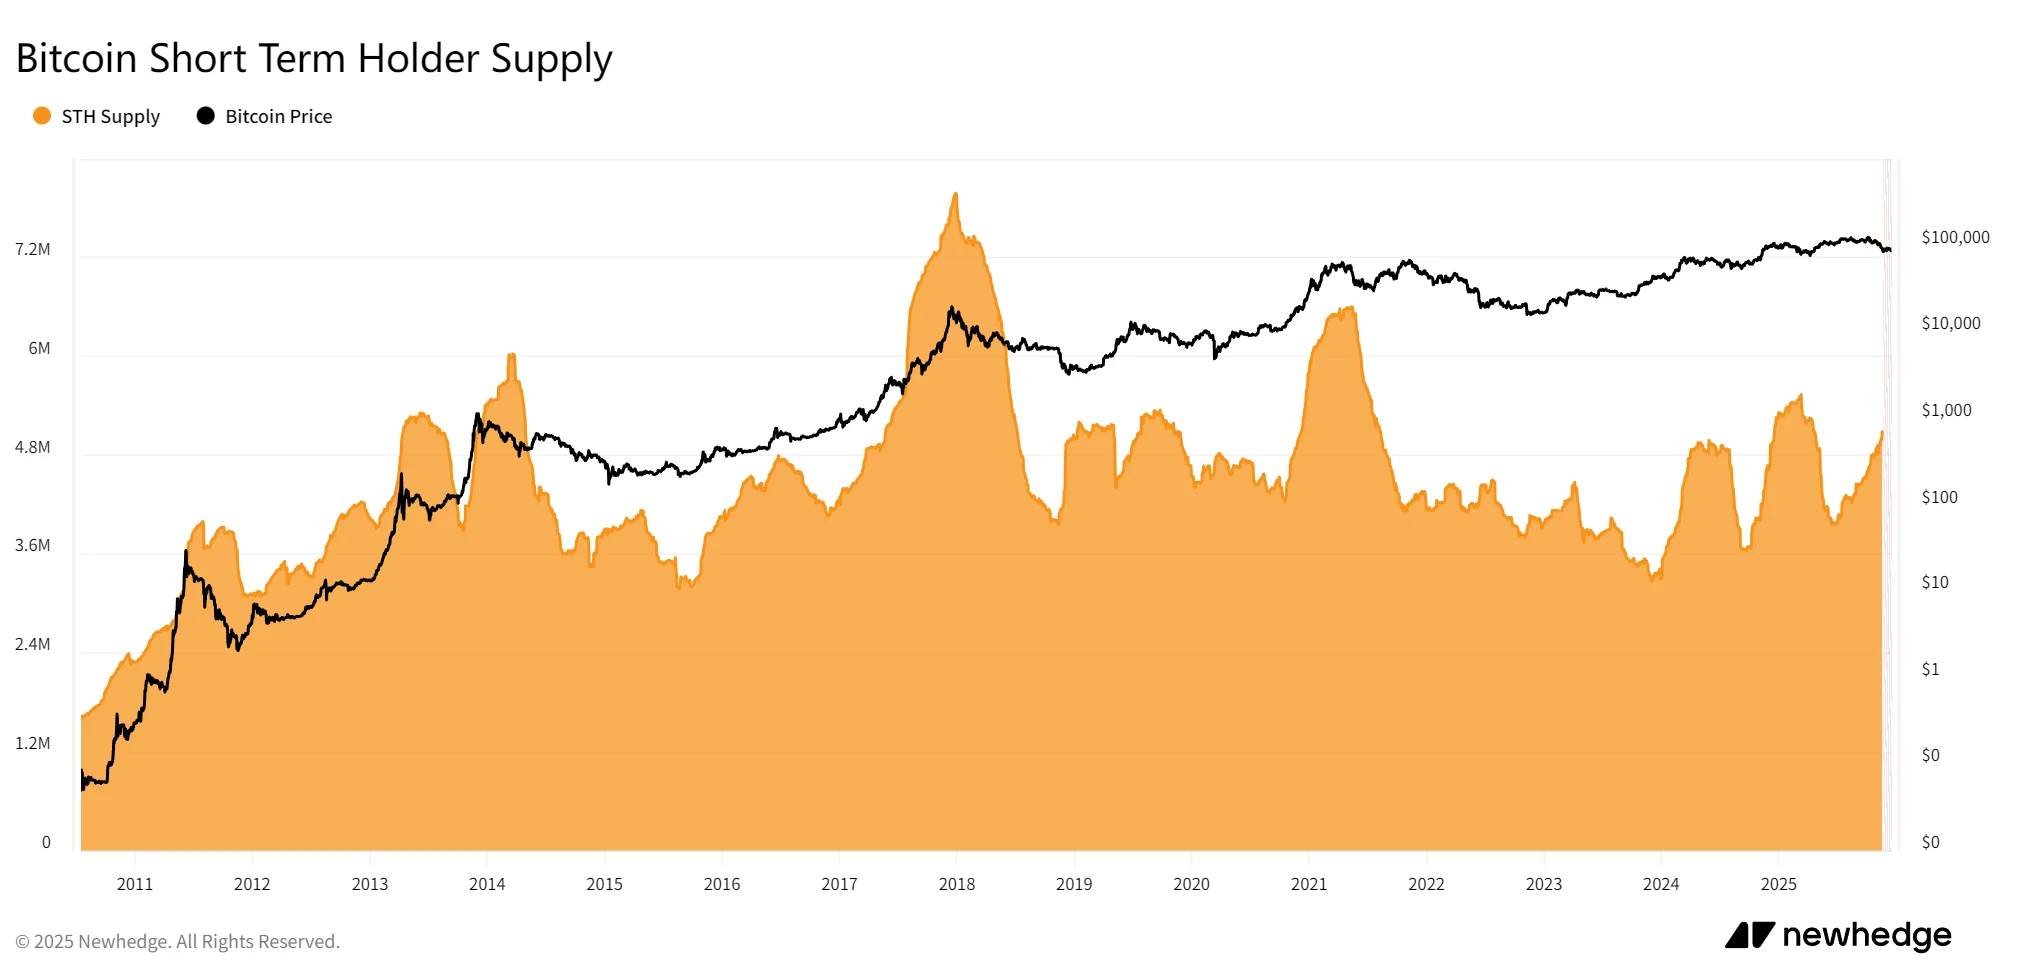
9. Bitcoin Short-Term Holder Supply (STH): Is there a surge in the number of short-term holders?
The Bitcoin Short-Term Holder Supply (STH) metric tracks the proportion of Bitcoin held for less than 155 days, helping to assess whether traders are acting as speculators.
Its mechanism captures new inflows of capital: a high STH ratio indicates speculative activity, often signaling a market peak; a low ratio suggests that the market is mature. In other words, a high STH means “too many novices,” making the bubble more likely to burst.
Historically, STH has increased just before each bull market peak.
● In 2017, the peak STH was nearly 8 million BTC, marking a peak in speculative activity.
● In 2021, during the double top, the first peak STH was around 6.5 million BTC, but the second peak did not reach that level due to selling pressure.
Currently, STH continues to rise, approaching 5.5 million BTC. However, the highest price point was on October 6th, and STH peaks no longer coincide with price peaks like in the previous two bull markets.
Source: https://newhedge.io/bitcoin/short-term-holder-supply
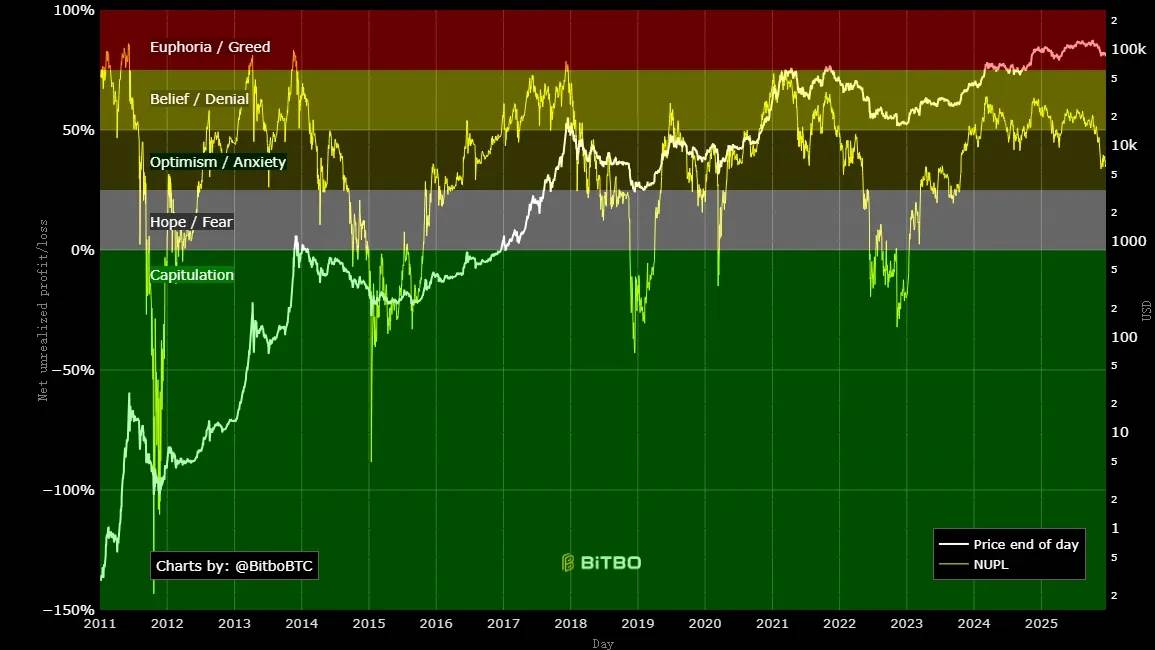
10. Bitcoin Net Unrealized Profit/Loss (NUPL): Has the unrealized profits and losses reached a level that could lead to excessive greed?
The Bitcoin NUPL metric measures the overall unrealized profits and losses in the market, helping to assess market sentiment.
Its principle is simple: calculate the market value minus realized value, then divide by the market value. A value above 0.75 indicates excessive greed (a sign of a market peak); a value below 0 indicates fear (a sign of a market bottom). In other words, a high NUPL means “everyone is sitting on profits,” increasing the risk of selling.
历史上,Bitcoin NUPL在每轮牛市顶部前都有极端高的表现:
● 2017年顶部:超过0.8,是历史极值;
● 2021年双顶:超过0.7,随后崩盘;
而当前(2025年Q4),NUPL在2024年3月初触及0.64的高位后持续震荡,现已跌至0.34。
Source:https://charts.bitbo.io/net-unrealized-profit-loss
结语:本轮比特币牛市出现结构性变化
从以上指标来看,目前比特币市场走势与过往牛市顶部的极端表现并不高度符合。历史顶部往往伴随多指标同时过热,如高Z-Score、高Puell Multiple和NUPL进入贪婪区,伴随LTH抛售和STH激增,但如今这些指标的表现却十分温和。
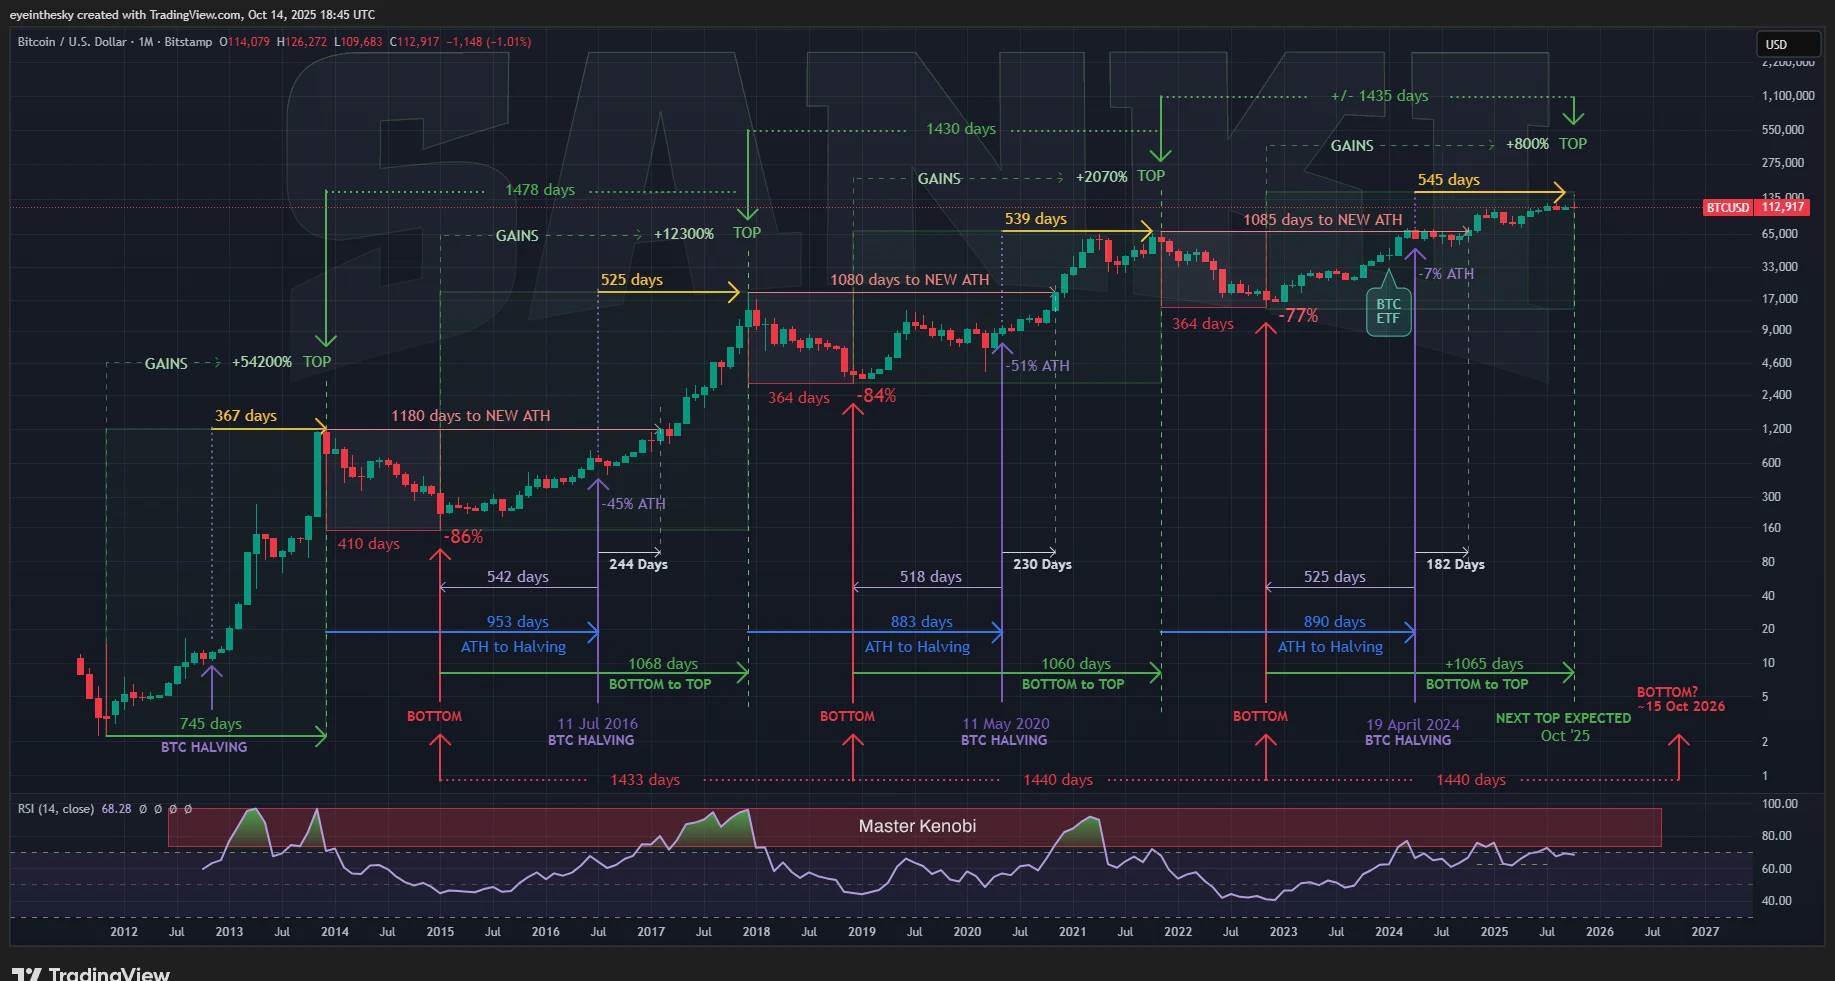
这并非说明当前比特币价格尚未见顶,这些指标均是以空间作为判断依据的,而下面这张以3年时间周期来预判币价顶部的示意图,似乎说明比特币已经见顶。
Source:https://x.com/btc_MasterPlan/status/1978180632410042828/photo/1
Of course, when we analyzed these indicators, we also found that these tools based on linear price trends actually started showing signs of decline at the peak levels. For example, the MVRV values reached 10, 7, and 3 respectively at the peaks of the bull markets in 2017, 2021, and 2025. It seems unlikely that MVRV will reach 7 during this current bull market, and it’s also difficult to predict reliable values corresponding to the peak of a bull market based on MVRV alone.
In other words, while these indicators suggest that the market is in a neutral or moderate range, they don’t confirm that a bull market is still ongoing or that a bear market has begun. Instead, they indicate that the growth in the Bitcoin market has become more gradual rather than explosive. This might be due to the following factors:
● First, the introduction of Bitcoin ETFs has attracted significant long-term capital, stabilizing supply dynamics. This contrasts with past bubbles driven by retail trading, thereby slowing down the rate of overheating.
● Second, changes in global liquidity in 2025 (Federal Reserve cuts vs. Japanese interest rate hikes) and geopolitical developments continue to affect the price of BTC. However, the stable trends shown by various indicators suggest that the market has become more mature.
In summary, regardless of whether the current peak on October 6th represents the top of this bull market cycle or not, we must acknowledge that Bitcoin’s price fluctuations may have exceeded past historical norms and expectations. It seems that Bitcoin is undergoing a structural transformation from being a “cyclical asset” to a “mainstream reserve”. It should be noted that for investors, these indicators may require adjustments in thresholds or combined use in order to be effectively utilized in investment decisions.