Exchange Ranking
 Top Exchanges
 24h Volume Ranking
 Popularity Ranking
 Exchange BTC Balance
 Proof of Reserves
 Decentralized Exchanges
 Funding Rate
 Funding Heatmap
 Liquidation Data
 Max Pain
 Long/Short Ratio
 Whale L/S Ratio
 Binance/Okex/Huobi L/S
 Bitfinex Margin L/S
 ETF Tracker
 Solana ETF
 XRP ETF
 Hong Kong ETF
 Bitcoin Treasuries
 Crypto Reversal
 Ethereum Reserves
 HyperLiquid Wallet Analysis
 Hyperliquid Whale Watch
 Large Transactions
 On-chain Movement
 Bitcoin ROI
 Stablecoin Market Cap
 Options Analysis
 News
 Articles
 Economic Calendar
 Features
 Wallet
 Contract Calculator


 Security
 Collections
 Watchlist
 Following
 XRP
Recently, the price of Ripple (XRP) has caused many investors to worry. The price has been hovering around $2.75, and the pressure from bears continues to be strong. Based on on-chain data and liquidity conditions, XRP could fall by another 10%, potentially reaching even lower levels. However, some believe that this might be an opportunity for bulls to enter the market. If buying pressure increases, the market could experience a rebound. Whether this is a crisis or a turning point depends on future changes in market conditions.

Key points:
● XRP is hovering near the $2.75 support level, with a risk of a 8% to 10% decline to $2.50.
● On-chain URPD data shows that there is heavy buying activity in the range of $2.45 to $2.55.
● Factors related to liquidity compression and ETFs could drive the market into an expansion phase.
The price of Ripple (XRP) is at a critical point. The cryptocurrency is currently in a consolidation phase at the bottom of a descending triangle, with a clear bearish atmosphere. Currently, XRP is fluctuating around the $2.75 support level. If selling pressure continues, prices could drop to the range of $2.65 to $2.45.
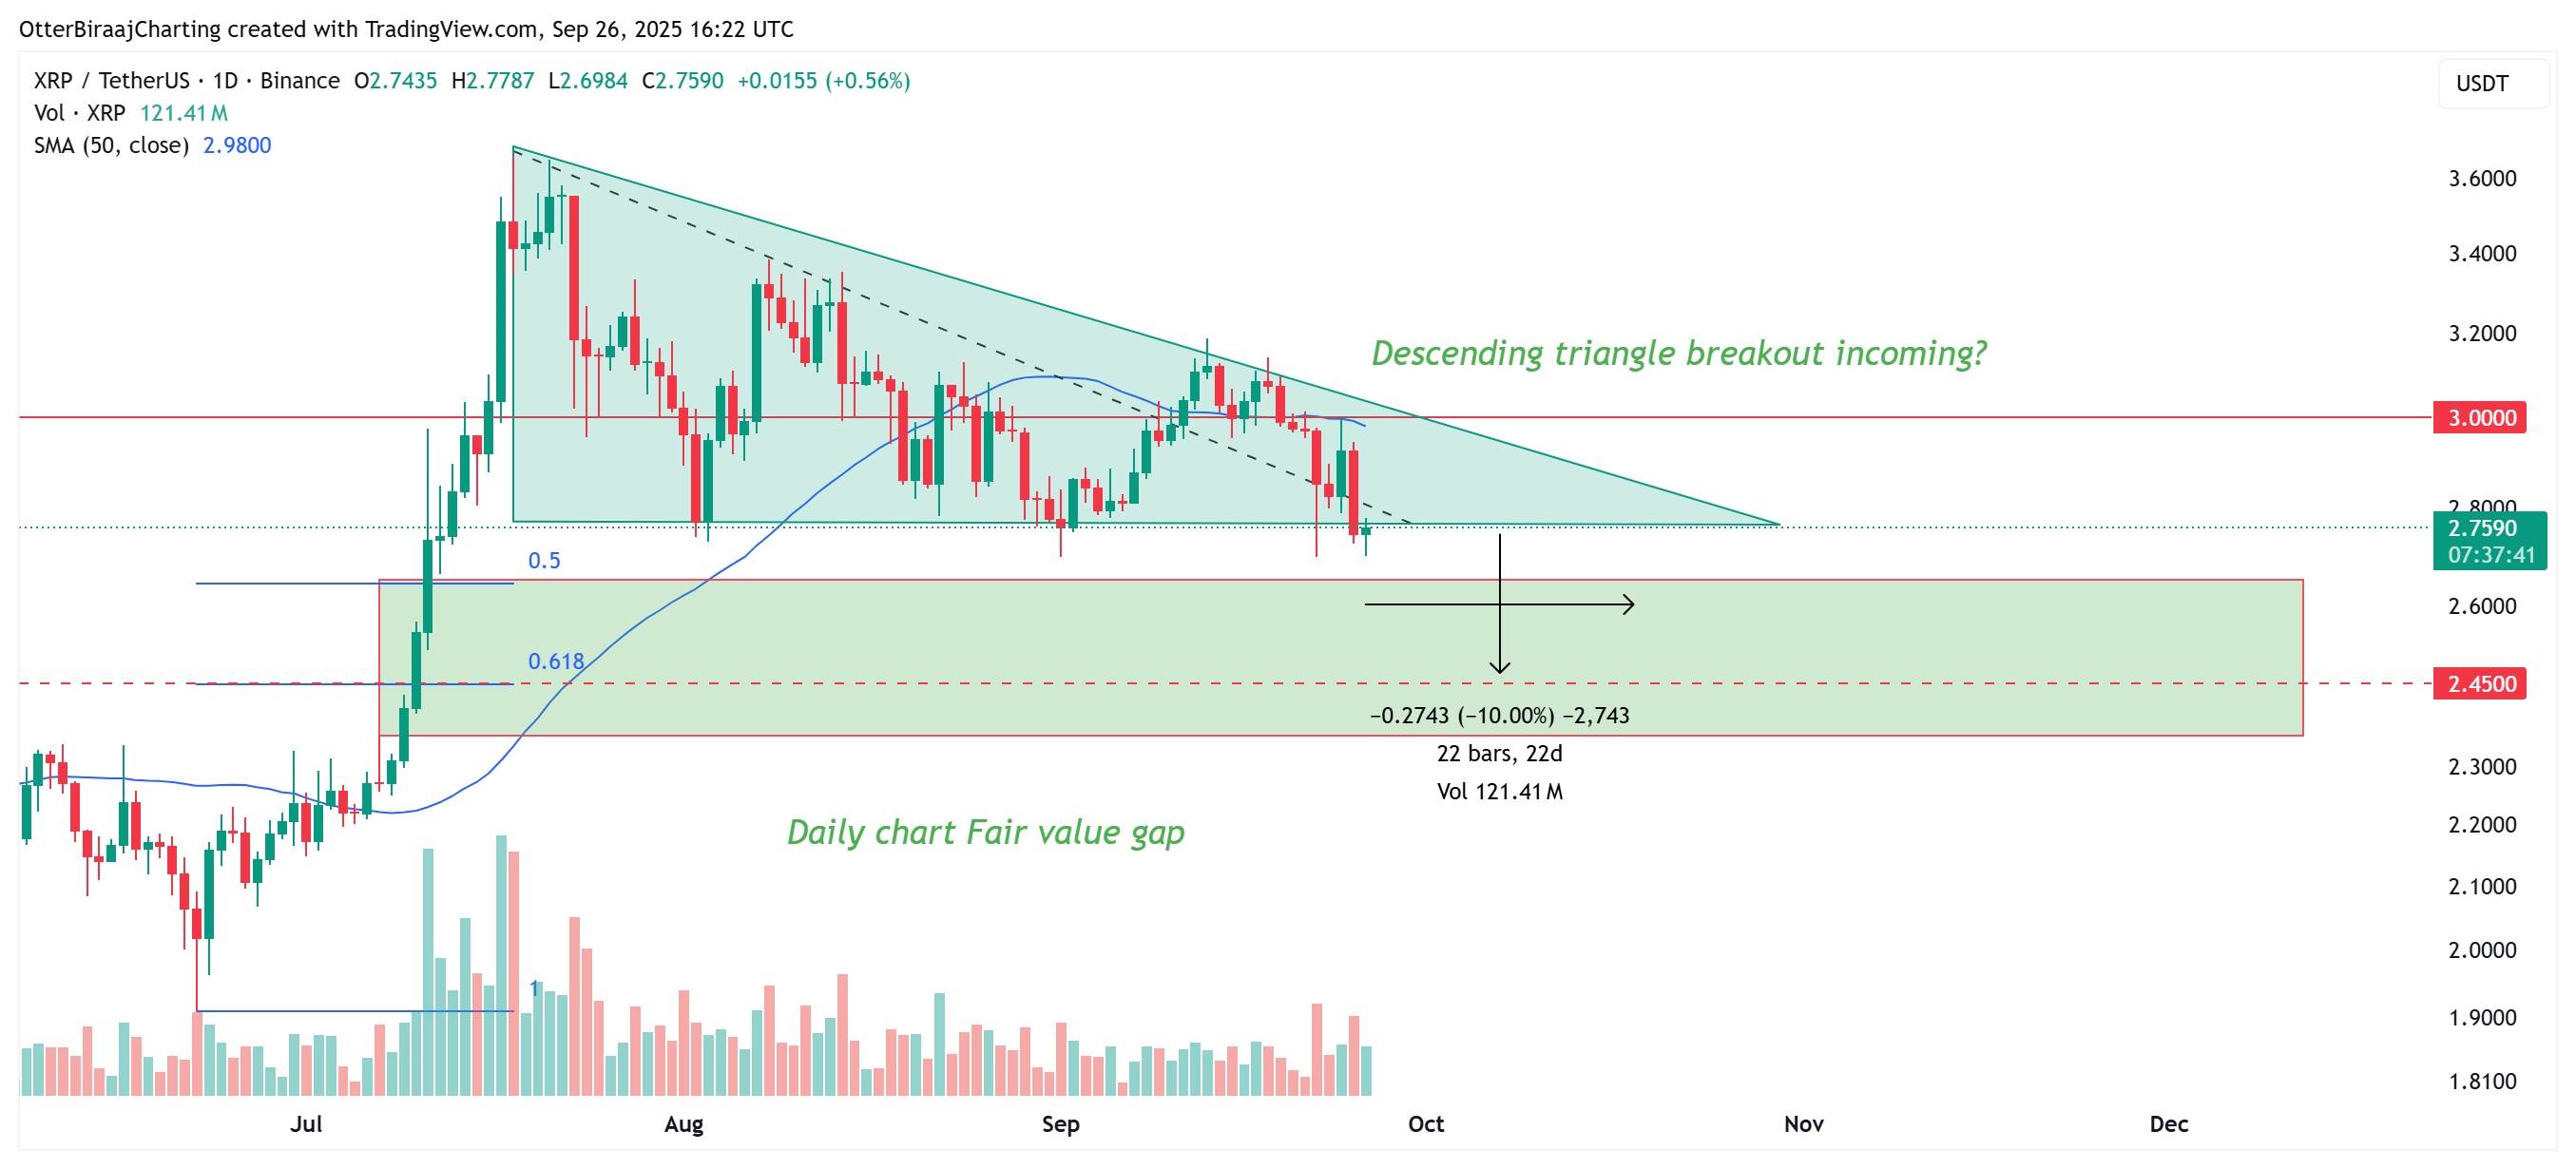
Analysis of the XRP daily chart. Source: Cointelegraph/TradingView
If the above trend persists, XRP could decline by another 8% to 10%, overlapping with the daily fair value gap (FVG) and the 0.50–0.618 Fibonacci retracement range. This area could become a point of liquidity concentration. A subsequent bullish rebound may find support here.
Data from the blockchain further supports the conclusions drawn from technical analysis. Glassnode’s Unrealized Price Distribution (URPD) for XRP shows that there is a high concentration of buyers in the range of $2.45 to $2.55. This indicates that many holders have their costs concentrated within this range. If prices once again reach this range, buyers are likely to take defensive positions, thereby laying the foundation for a rebound.
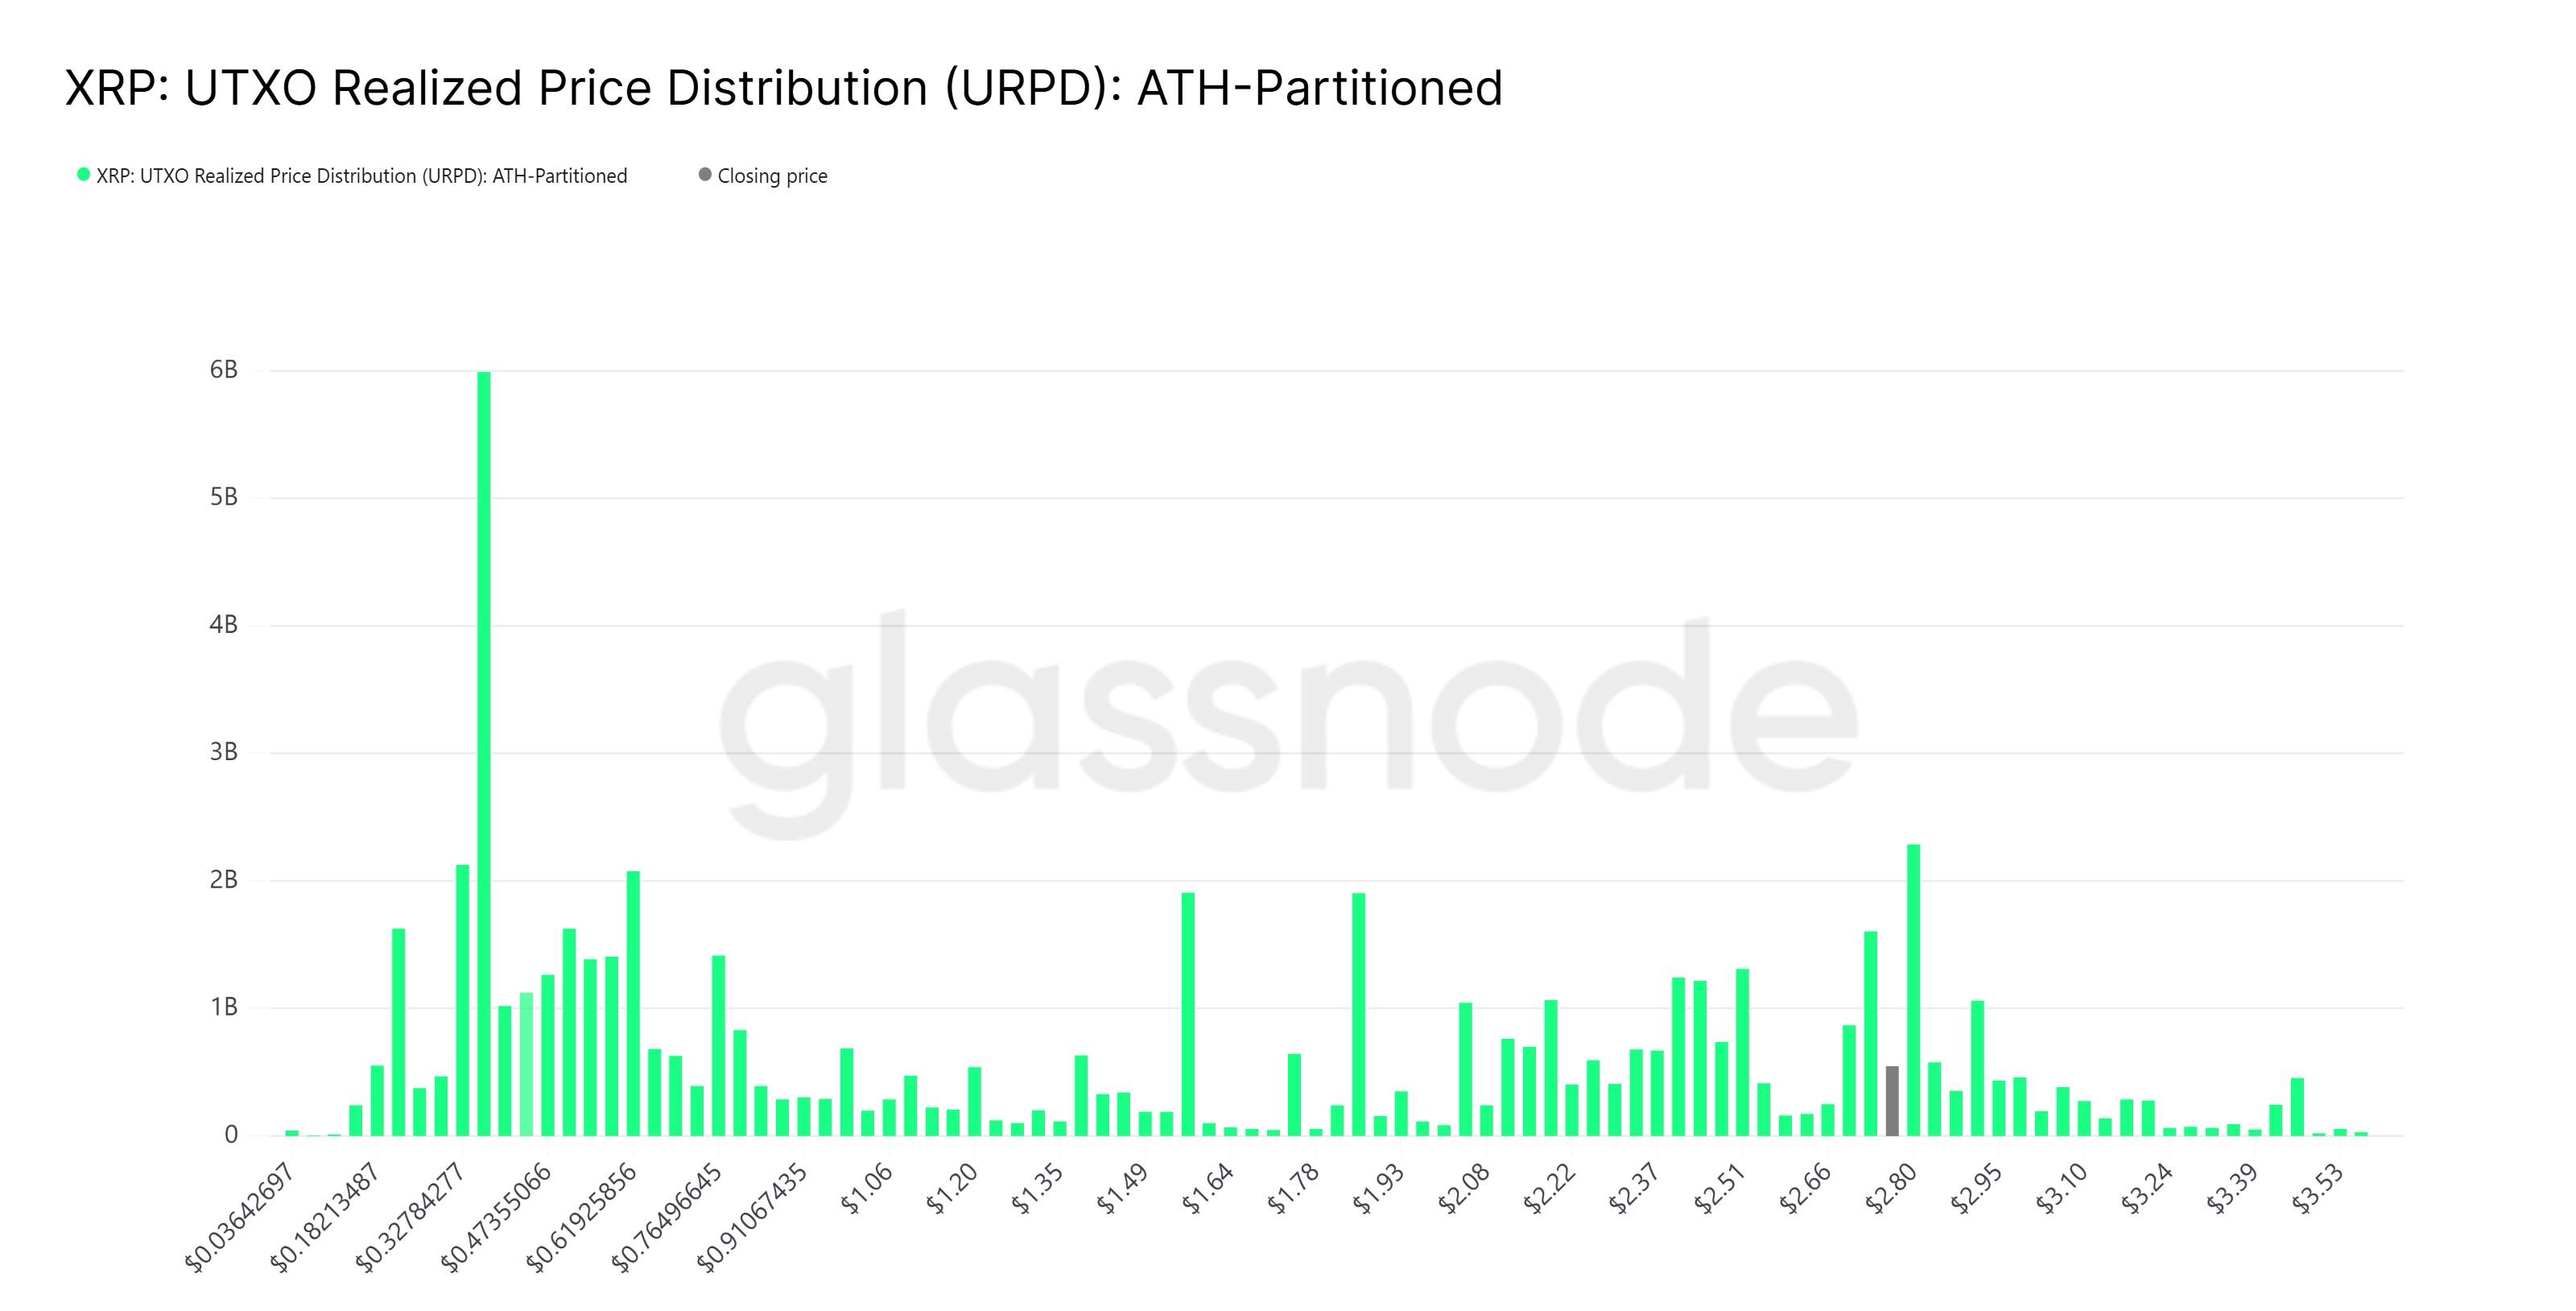
The Unrealized Price Distribution of XRP UTXOs. Source: Glassnode
XRP’s recent performance is consistent with the historical trends observed in the first quarter. This cryptocurrency has tested the level of $2.65 twice, but historical patterns suggest that prices may fall below this level before a real rebound occurs, entering a liquidity-rich FVG range.
Another similarity between current trends and early historical patterns is that prices usually weaken before weekends, and then fluctuate around the fair value range at the beginning of each new week. If this happens, XRP could test the $2.50 range as early as Monday.
Although the trends are highly similar, historical patterns do not guarantee that prices will follow the same path. The market could still deviate from these patterns.
If prices break through $2.90, then the bearish pattern might end sooner than expected. However, the current weak market trend suggests that prices could drop back to the $2.50 range.
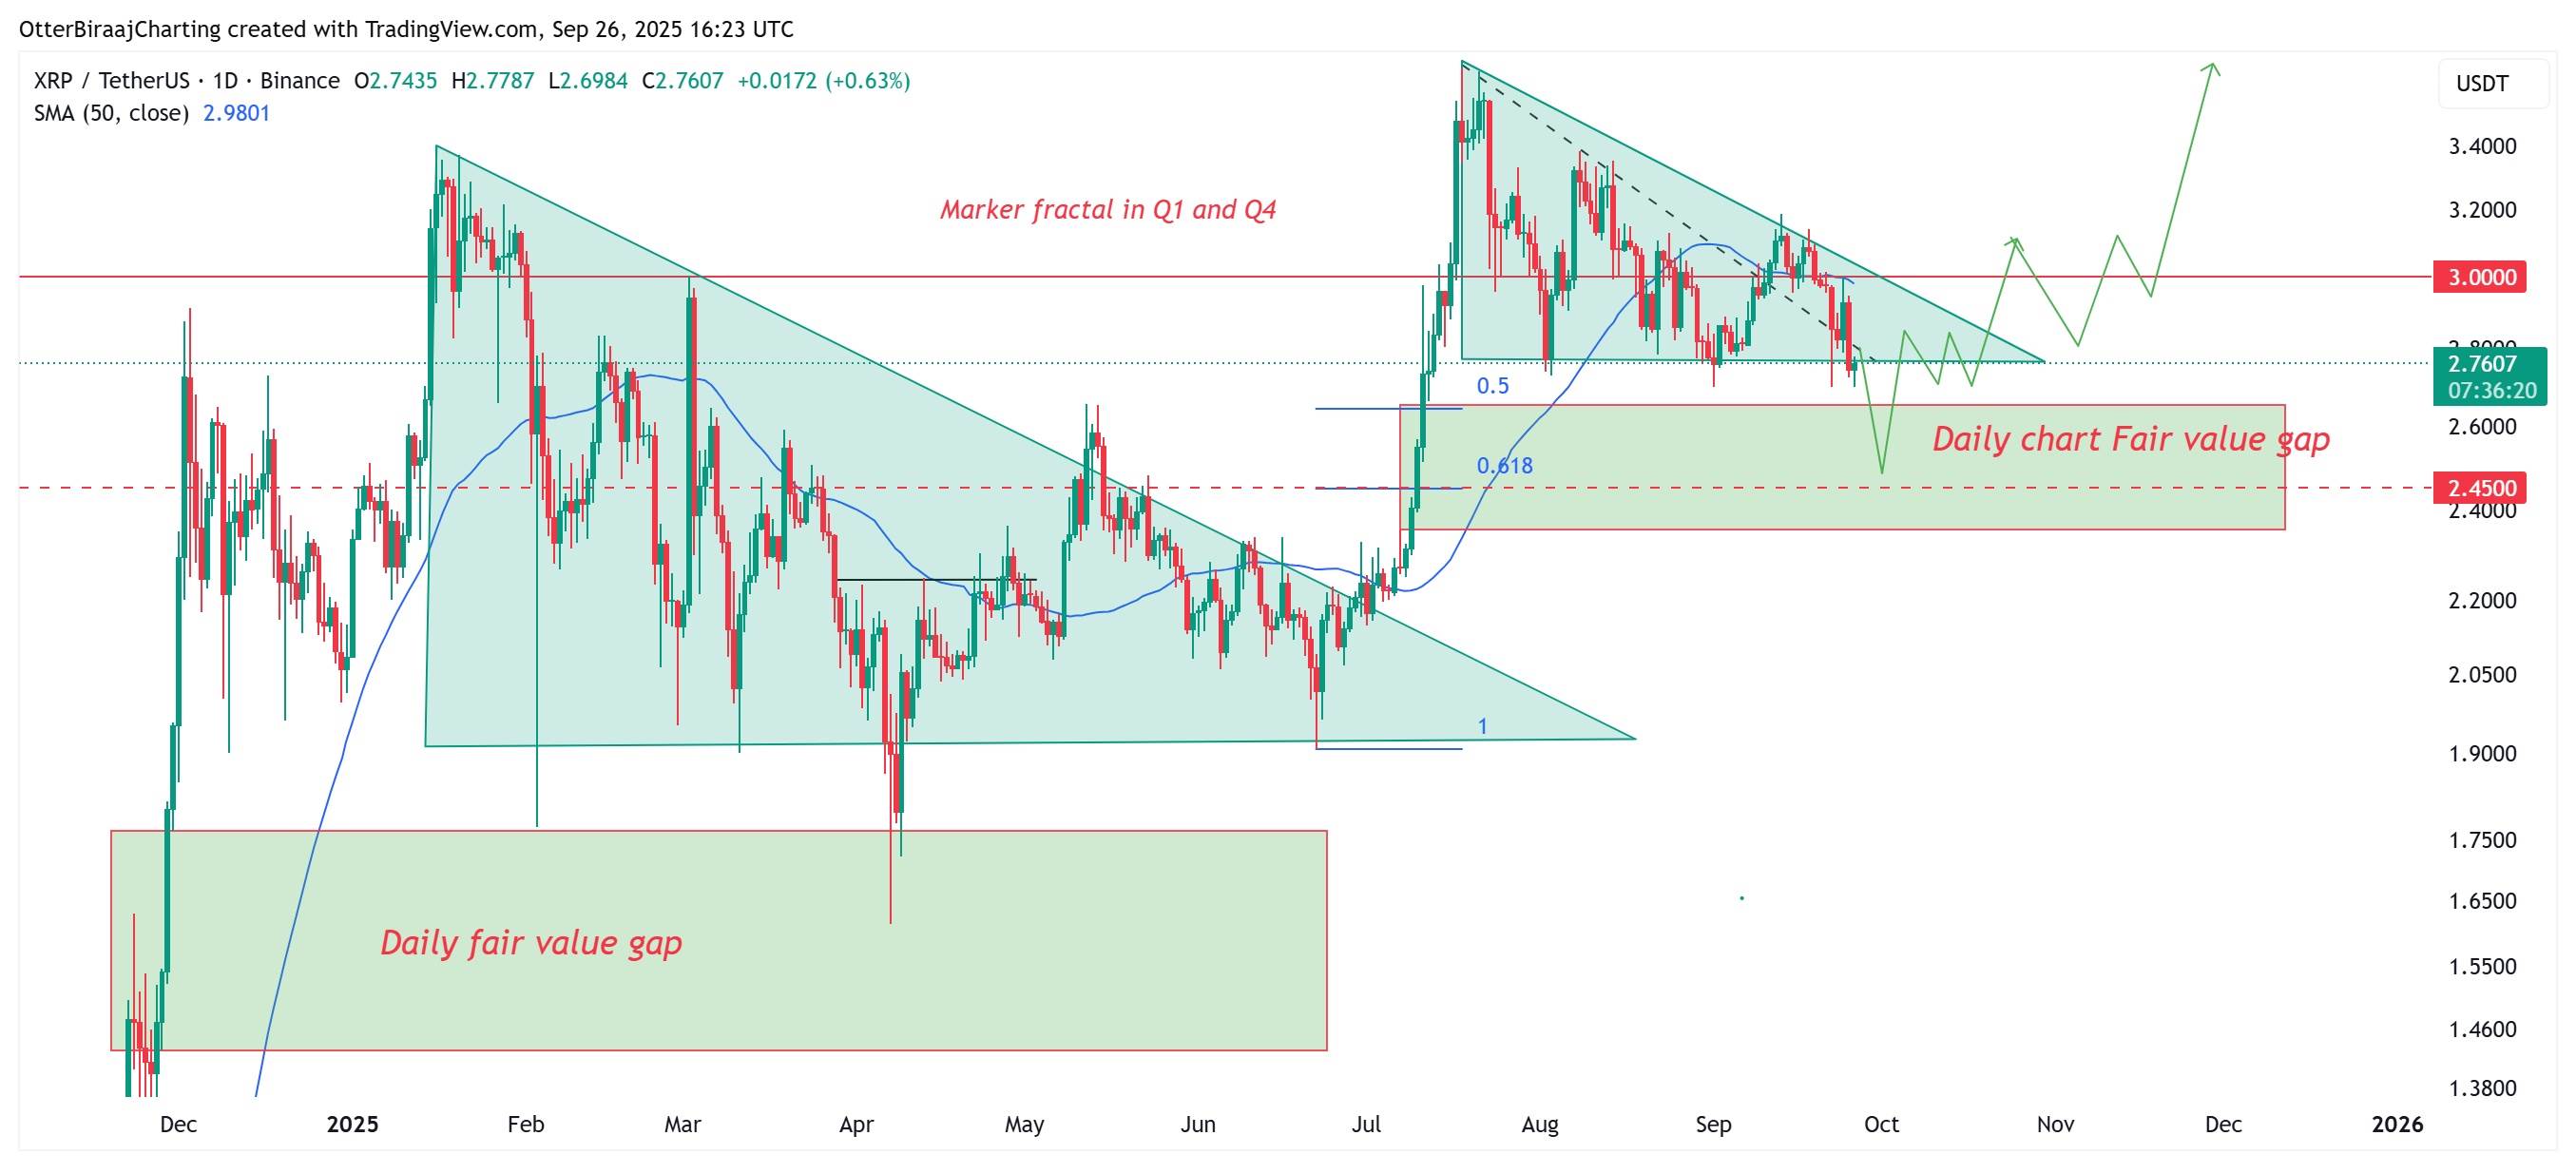
Analysis of XRP’s price patterns in the first and third quarters. Source: Cointelegraph/TradingView
The compression of XRP liquidity and factors related to ETFs could increase volatility.
Market research firm Sistine Research indicates that XRP is expected to enter a crucial phase of expansion in the coming months. Analysis shows that over the past 10 weeks, the price range of XRP has narrowed, with orders being concentrated within a smaller range, and the gap between different levels has increased. Since the U.S. elections in November 2024, XRP has been in its third phase of compression, with this round of compression being particularly significant, occurring after three consecutive highs. Under similar conditions, the release of accumulated liquidity typically leads to significant breakouts. Sistine Research’s analysis of XRP’s compression pattern reveals that the flow of funds in the spot market continues to show a continuous struggle between buyers and sellers. The 90-day active volume difference (CVD) indicates that sellers still dominate the market, although buyers briefly gained momentum at the beginning of 2025. For prices to continue rising, there must be a clear shift in buyer activity, which has not yet occurred. Meanwhile, news regarding ETFs has a significant impact on the market. Franklin Templeton’s decision to delay the launch of the XRP ETF until November 14th resulted in nearly $38 million in trading volume on the first day of trading for the XRPR. Analysts point out that the market’s optimistic expectations regarding ETFs have been partially reflected in current prices, increasing the risk of “selling when opportunities arise”.