Exchange Ranking
 Top Exchanges
 24h Volume Ranking
 Popularity Ranking
 Exchange BTC Balance
 Proof of Reserves
 Decentralized Exchanges
 Funding Rate
 Funding Heatmap
 Liquidation Data
 Max Pain
 Long/Short Ratio
 Whale L/S Ratio
 Binance/Okex/Huobi L/S
 Bitfinex Margin L/S
 ETF Tracker
 Solana ETF
 XRP ETF
 Hong Kong ETF
 Bitcoin Treasuries
 Crypto Reversal
 Ethereum Reserves
 HyperLiquid Wallet Analysis
 Hyperliquid Whale Watch
 Large Transactions
 On-chain Movement
 Bitcoin ROI
 Stablecoin Market Cap
 Options Analysis
 News
 Articles
 Economic Calendar
 Features
 Wallet
 Contract Calculator


 Security
 Collections
 Watchlist
 Following
 BTC
After experiencing a surge in popularity during the early stages, Bitcoin ETFs seem to be entering a phase of slowing down. Market sentiment is shifting from excitement to rationality, and investors are beginning to reconsider the gap between actual prices and expected levels. At the same time, voices from the bear camp are growing louder, with many people focusing on the key level of $90,000. Is this a temporary pause for bulls to build strength, or is it the start of a new attack by the bears? The answer could determine Bitcoin’s next move.

Key points summary
● The slowdown in funding for spot Bitcoin ETFs indicates weak demand from institutional investors, suggesting that bullish sentiment is waning.
● $108,000 is the short-term target for the bears; some Bitcoin analysts expect prices to drop to $90,000.
Bitcoin sellers emerged again on Thursday. As prices fell to $111,000, concerns about further adjustments towards $90,000 increased.
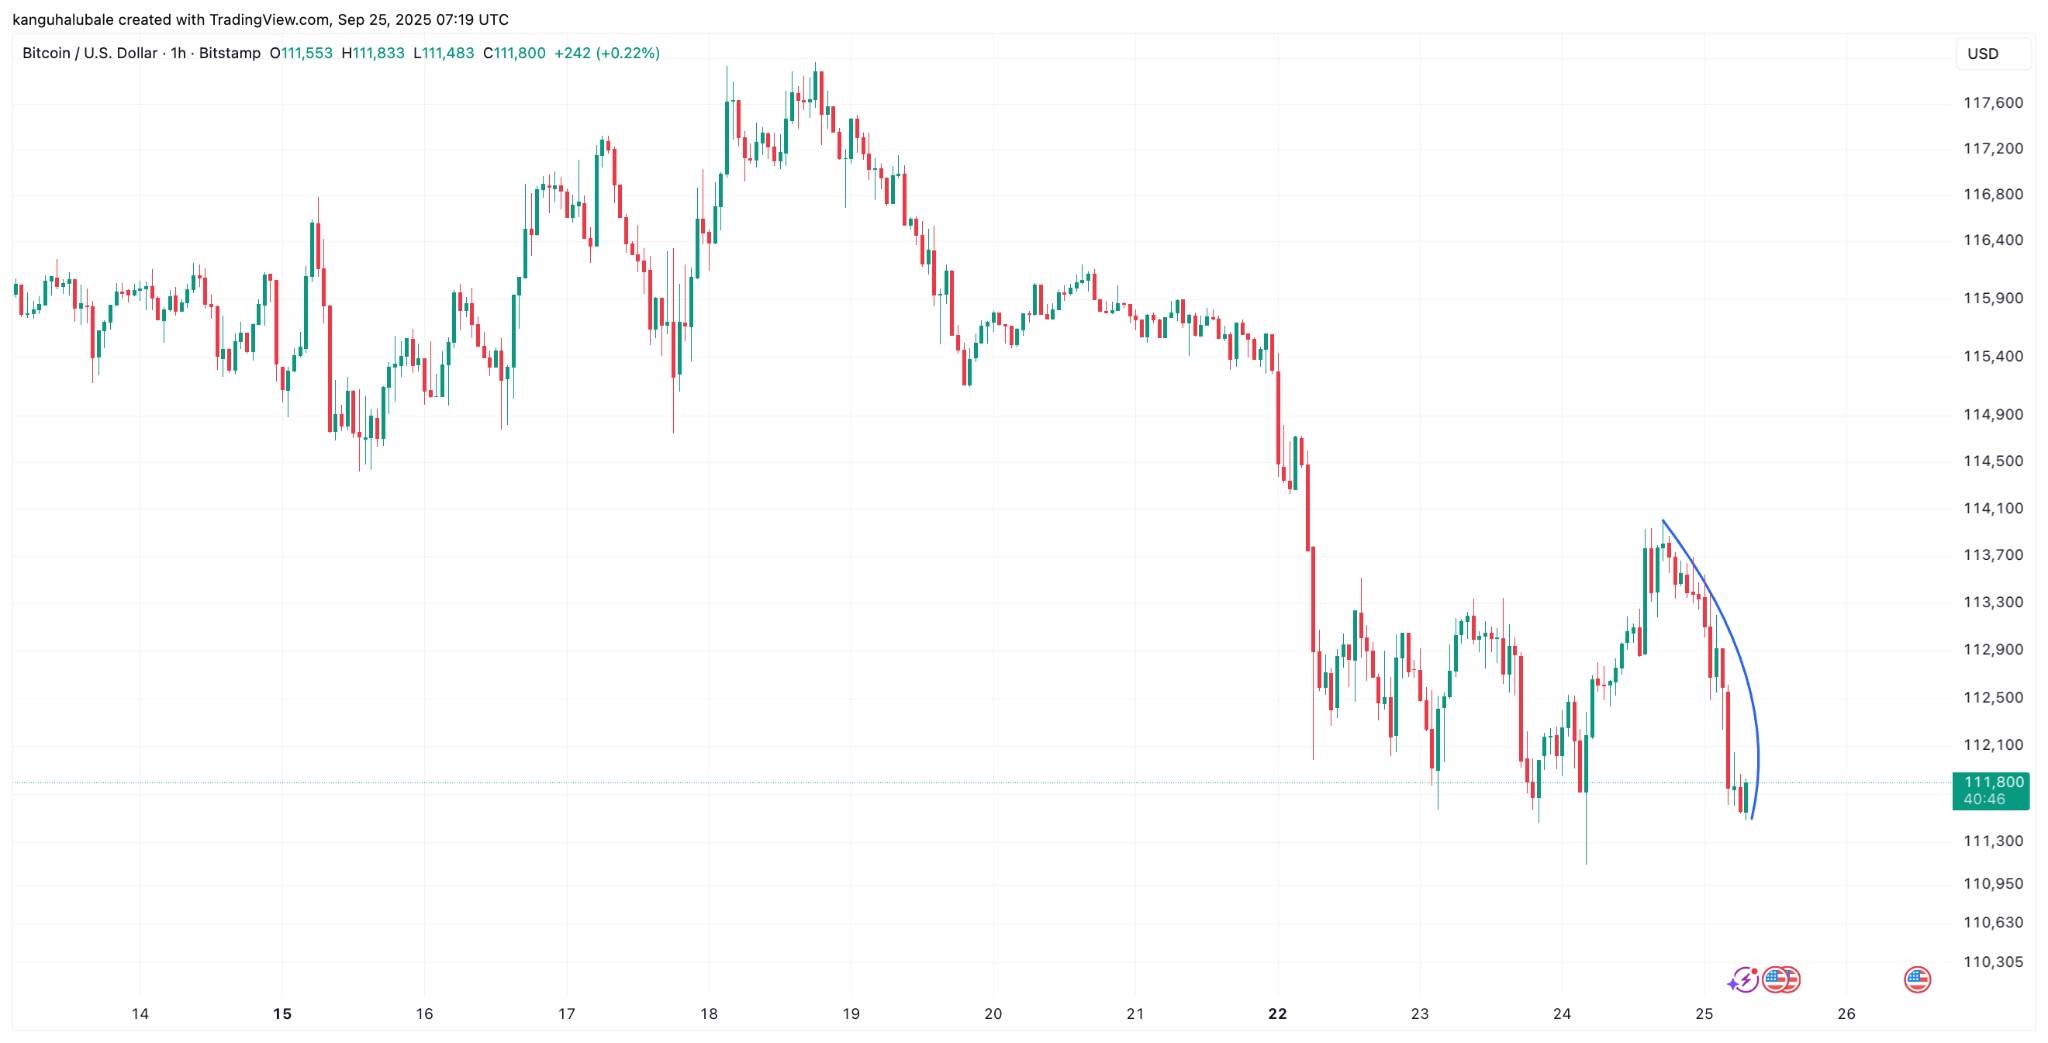
Hourly chart of BTC/USD. Source: Cointelegraph/TradingView
Demand for Bitcoin ETFs is weakening.
After Bitcoin prices weakened recently, institutional investors are reducing their holdings in spot Bitcoin ETFs.
According to Glassnode’s latest “Weekly Market Pulse” report, funding for Bitcoin ETFs cooled after a strong influx at the beginning of September. Net inflows dropped from $2.03 billion last week to $931.4 million this week, a decrease of 54%.
According to data provided by a blockchain data service provider on the X platform on Wednesday, “Although the overall volume remains stable, the slowdown in capital flows indicates a temporary halt in institutional demand.”
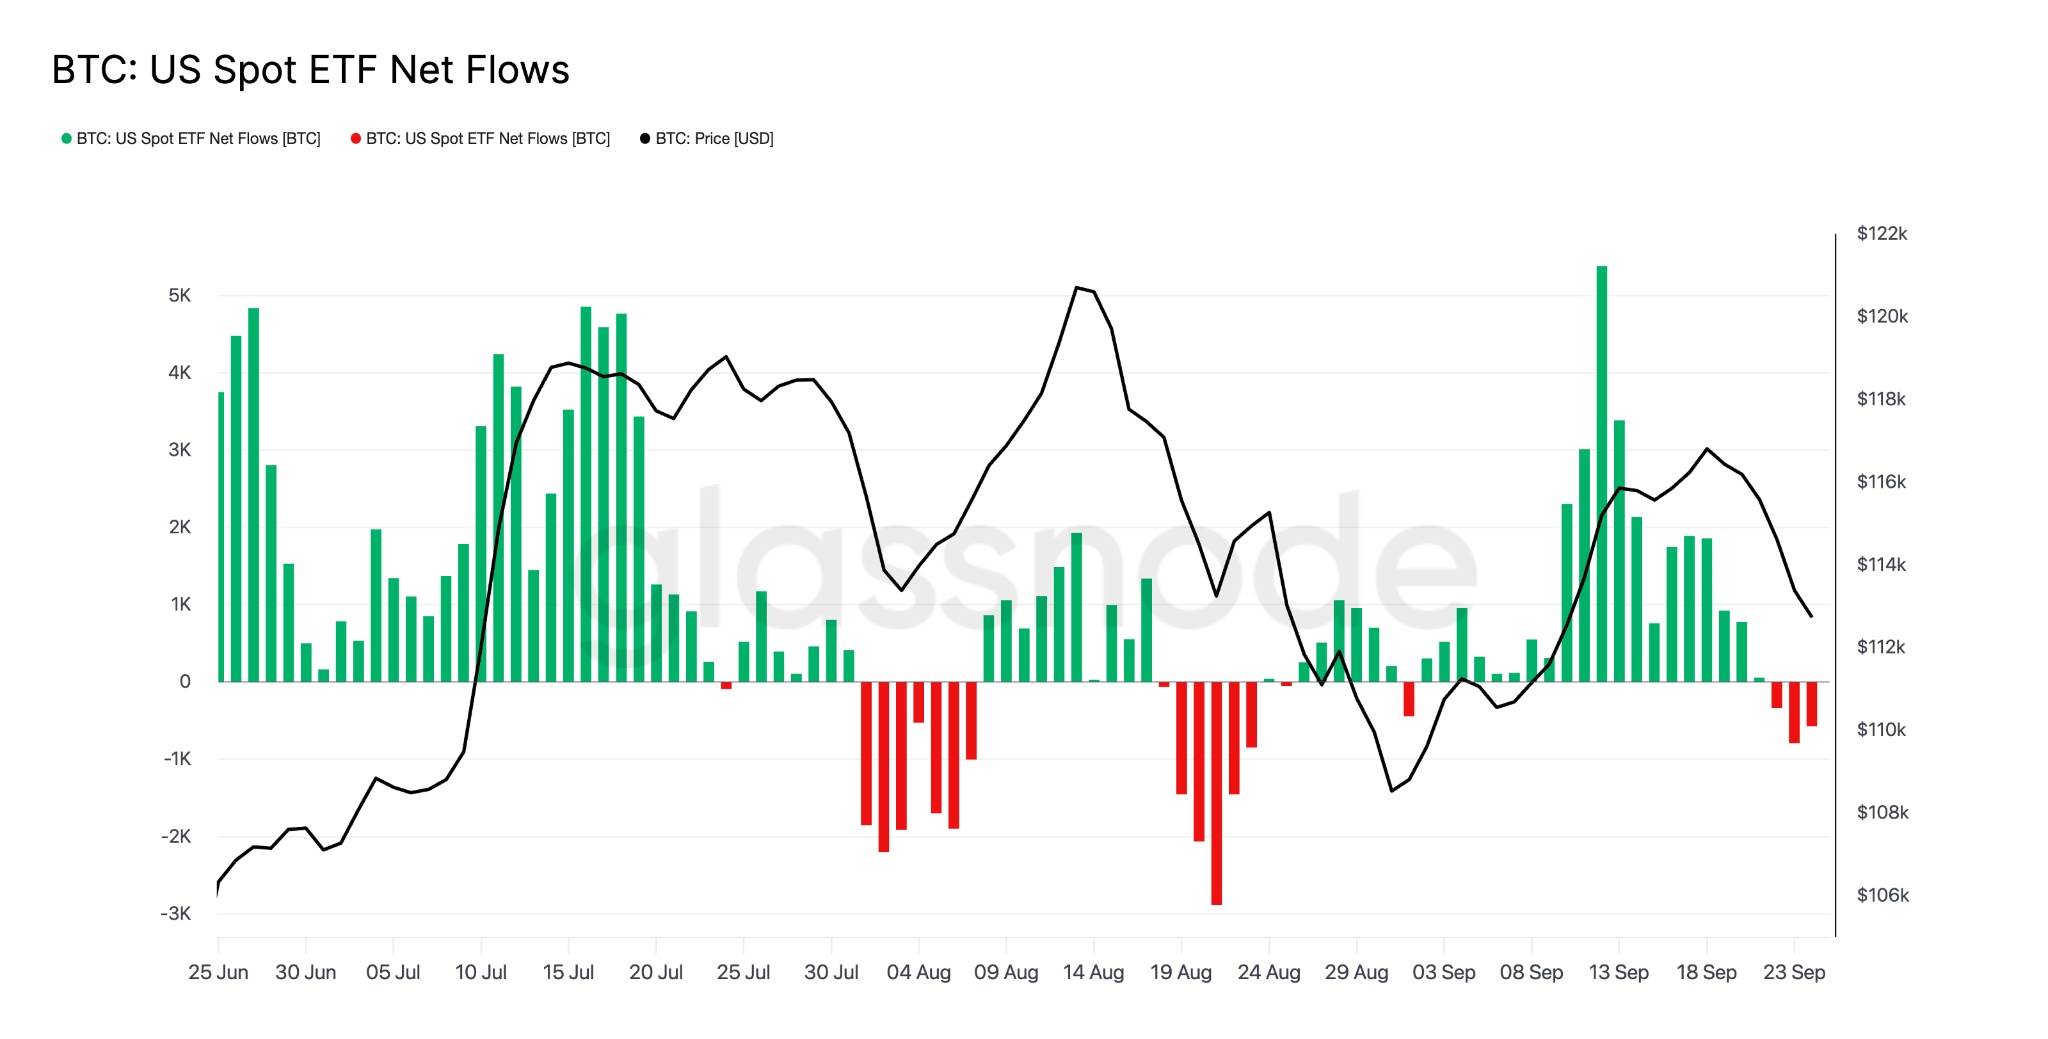
Net inflows into U.S. spot Bitcoin ETFs. Source: Glassnode
This situation contrasts sharply with early September, when prices steadily rose and ETF funding remained healthy.
According to Farside Investors data, between September 2nd and September 18th, the price of Bitcoin per unit increased by 10%, reaching nearly $118,000. During this period, net inflows totaled $2.9 billion over eight trading days, with the highest single-day inflow exceeding $741.1 million, the highest level since two months ago.
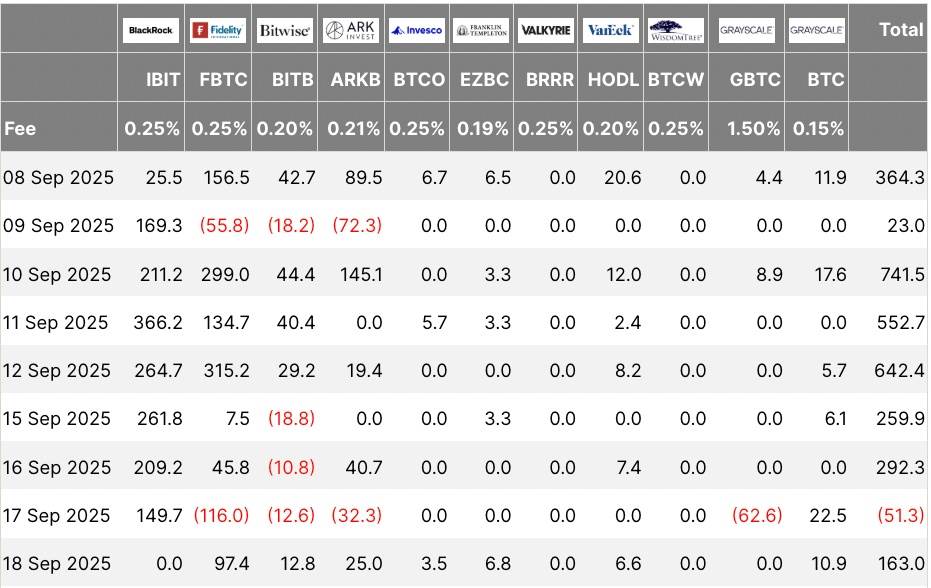
Net inflows into U.S. spot Bitcoin ETFs in February 2025 (screenshot). Source: Farside Investors
The cumulative buying-selling difference in the spot market’s buyer volume indicator tracks the cumulative difference between buys and sells over the past 90 days. Since mid-August, the market has been dominated by selling actions.
This indicates that retail traders have sold more Bitcoin than they bought, further reinforcing a risk-averse sentiment in the market.
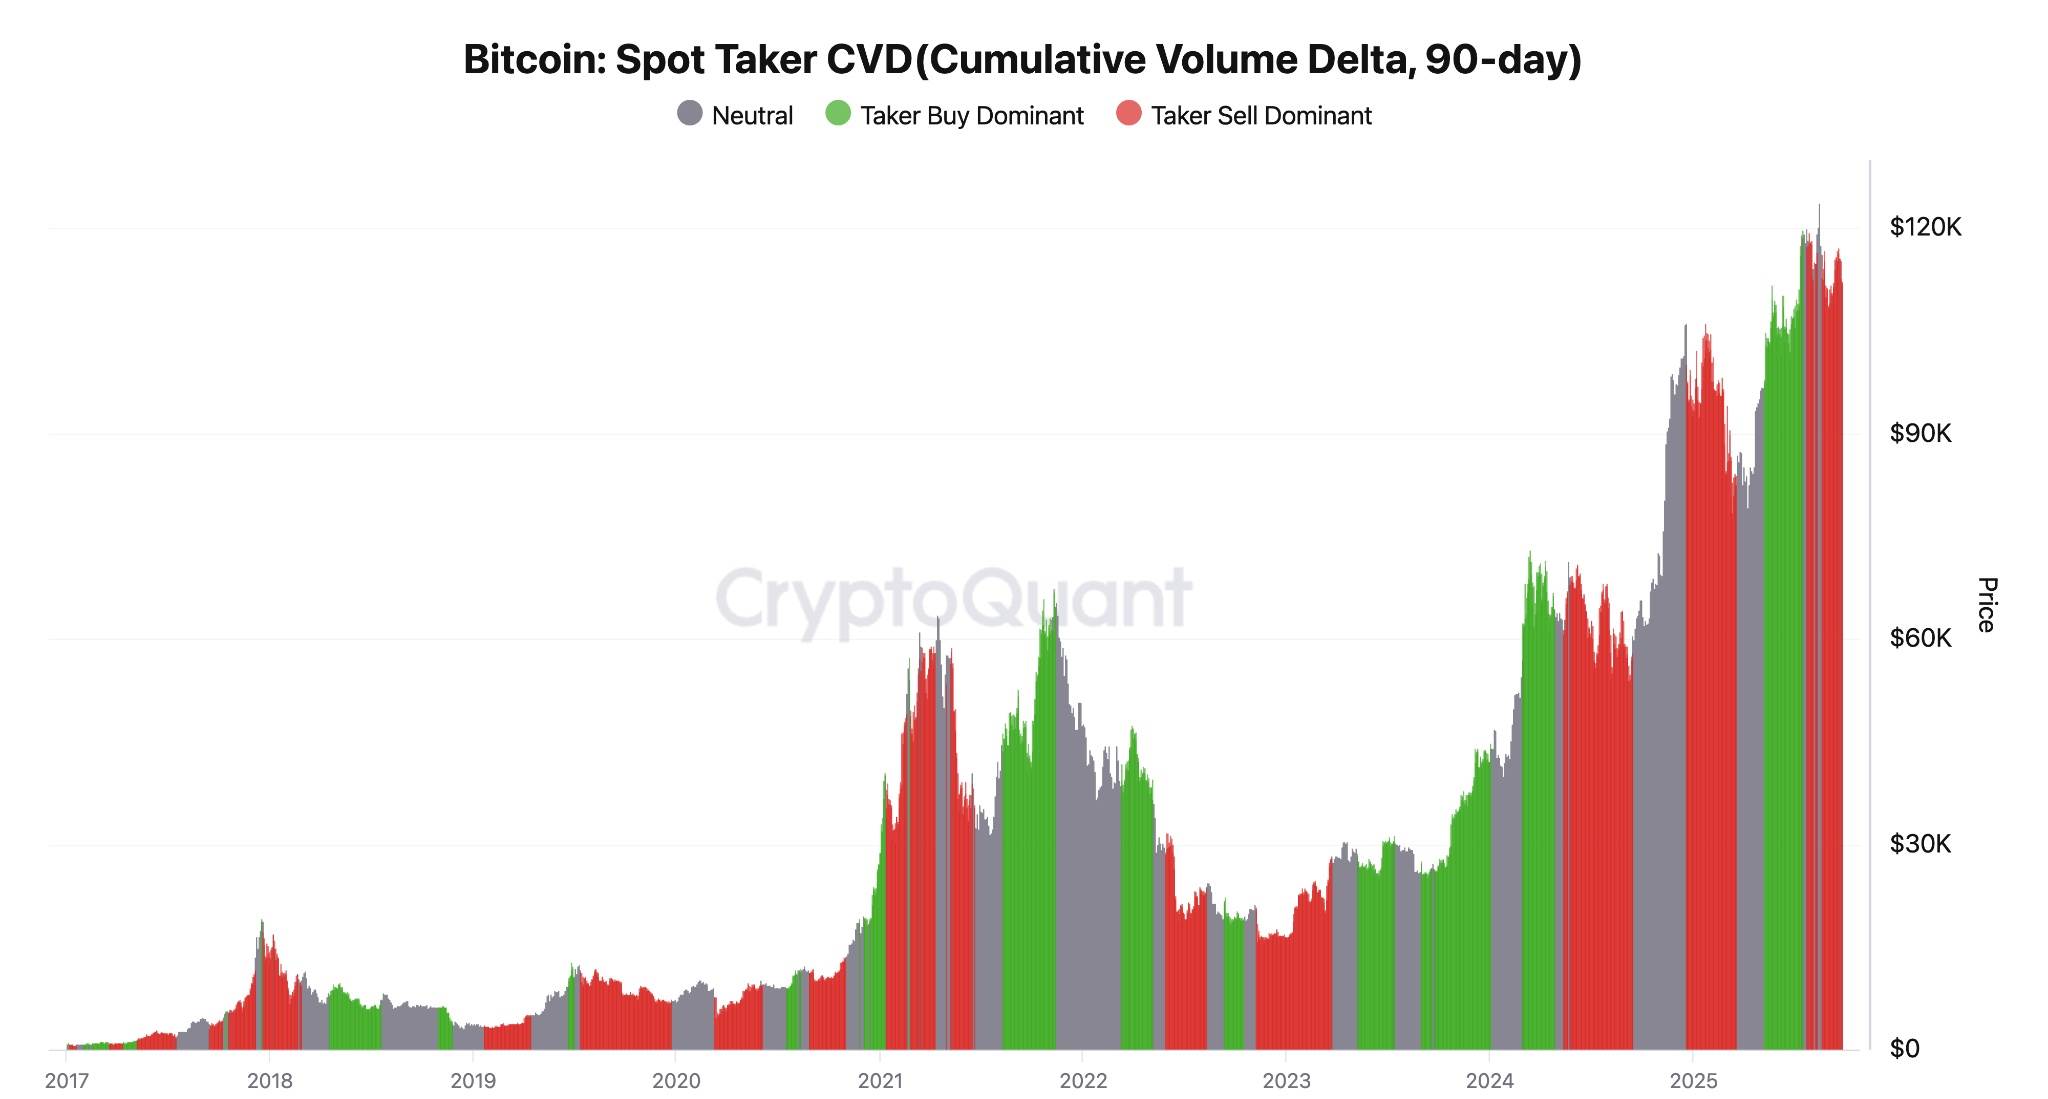
Buyer volume difference data for spot Bitcoin. Source: CryptoQuant
If ETF funding continues to decline and buyers in the spot market remain primarily sellers, Bitcoin could face deeper adjustments before October.
Will Bitcoin’s price experience a “deep pullback” to around $90,000?
As demand weakens, pessimism about Bitcoin’s price movement is increasing.
“After showing strong performance yesterday, Bitcoin did not continue with such impressive results.” Michael van de Poppe, founder of MC Capital, wrote on the X platform on Thursday.
Relevant charts indicate that if Bitcoin falls below the support level of $112,000 to $110,000, its price could drop to the demand zone of $103,000 to $100,000. This is considered a “relevant area for buying opportunities.”
“I believe there will be more declines in the market, and after this cycle ends, we will enter a phase of single-direction upward movement.”
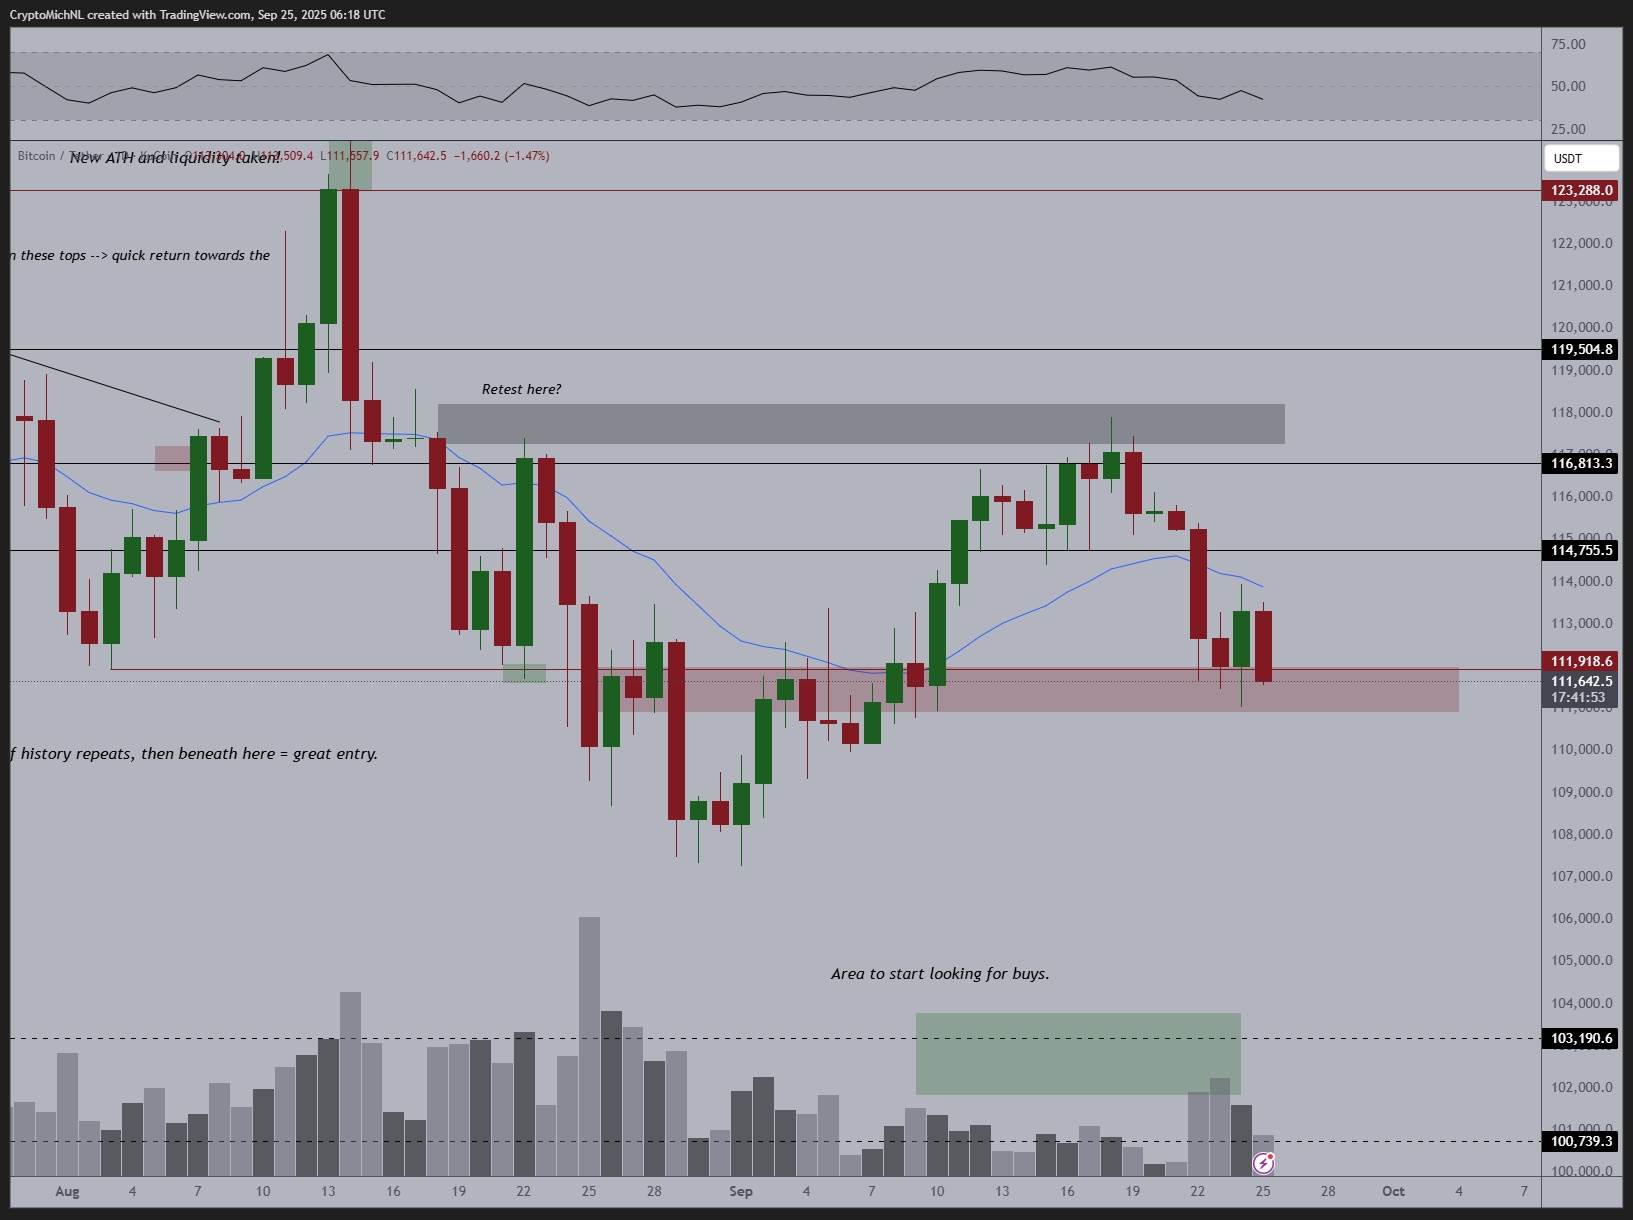
Daily chart of BTC/USD. Source: Michael van de Poppe
Meanwhile, analyst AlphaBTC shared a hourly candlestick chart of BTC/USD, showing that the pair is moving within a downward channel.
If the $112,000 support level is broken, Bitcoin could fall to around $108,000 at the bottom of the channel. If prices continue to decline, there may be a “deep pullback,” with the price potentially dropping to the range of $105,000 to $100,000.
Additionally, according to data from Glassnode, the price of Bitcoin has fallen below the 0.95 cost basis line (at $115,300), indicating potential risks. The cost basis indicator can be used to measure market risk levels and potential price ranges for Bitcoin.
“If the market can regain strength and stand above this level again, it would be a sign of recovery. However, if it fails to hold, price risks may shift towards the support zone around $105,000 to $90,000.”
If Bitcoin loses its support at $107,000, its double-top formation would point towards targets around $90,000.