Exchange Ranking
 Top Exchanges
 24h Volume Ranking
 Popularity Ranking
 Exchange BTC Balance
 Proof of Reserves
 Decentralized Exchanges
 Funding Rate
 Funding Heatmap
 Liquidation Data
 Max Pain
 Long/Short Ratio
 Whale L/S Ratio
 Binance/Okex/Huobi L/S
 Bitfinex Margin L/S
 ETF Tracker
 Solana ETF
 XRP ETF
 Hong Kong ETF
 Bitcoin Treasuries
 Crypto Reversal
 Ethereum Reserves
 HyperLiquid Wallet Analysis
 Hyperliquid Whale Watch
 Large Transactions
 On-chain Movement
 Bitcoin ROI
 Stablecoin Market Cap
 Options Analysis
 News
 Articles
 Economic Calendar
 Features
 Wallet
 Contract Calculator


 Security
 Collections
 Watchlist
 Following
 ETH
以太坊的价格正站在风口浪尖:一方面,4000 美元关口成为市场关注的核心;另一方面,高达 8000 万美元的 ETF 资金流出以及恐惧指数仅 34 的低迷情绪,让投资者心里打鼓。眼下的问题是,以太坊能否稳住阵地继续前行,还是会在压力之下失守关键位置?这一切都牵动着市场的神经。

根据SoSoValue数据显示,5天内以太坊ETF流出8亿美元,创下最大单周流出记录。最严重的抛售发生在周四至周五,当时以太坊价格跌破4000美元。
● 富达以太坊基金:流出3.6亿美元
● 贝莱德ETHA基金:流出2亿美元
● 每日流出:连续数日超过2.5亿美元
尽管机构抛售,以太坊仍保持韧性。到周日,以太坊价格回升至4000美元以上。买家依然认为这一价位具有价值。价格反弹不仅是散户逢低买入,还有长期投资者对以太坊基本面(去中心化金融和企业采用)的坚定信心。
恐惧指数发出谨慎信号但也带来机会
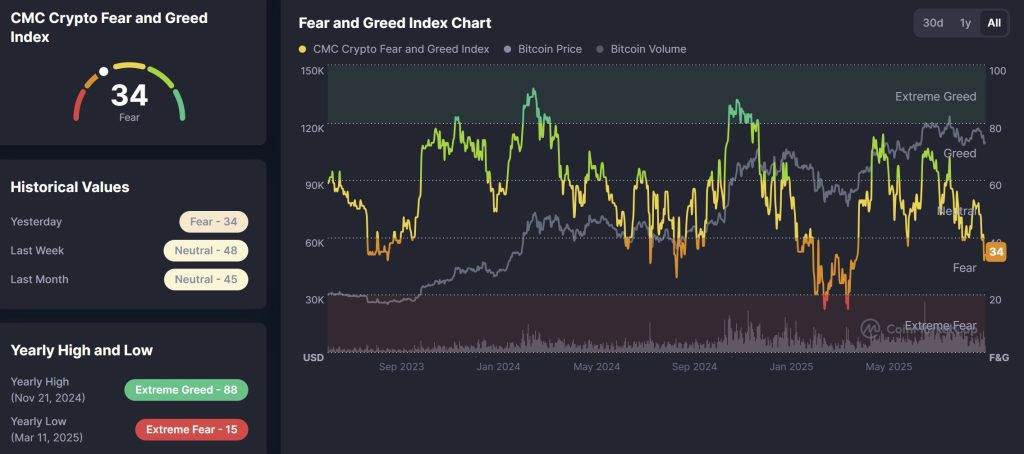
尽管以太坊从ETF驱动的损失中恢复,但整体市场情绪依然脆弱。加密恐惧与贪婪指数目前为34,处于“恐惧”区域。历史上,这种悲观情绪可能会抑制短期买入,但也为逆向投资者提供了有吸引力的入场点。
Macroeconomic challenges have increased uncertainty. The strengthening of the US dollar, hawkish signals from the Federal Reserve, and fluctuations in the stock market have all put pressure on digital assets.
Nevertheless, Ethereum has managed to remain above $4,000 during these difficult times, highlighting the importance of this level as a psychological barrier.

In reality, Ethereum’s price movement is being influenced by two opposing forces:
● Negative factors due to institutional outflows and global risk aversion
● Positive support from retail demand and contrarian sentiment in the market
This delicate balance highlights why $4,000 is considered the “trough” level for Ethereum in the short term.
Forecast for the price of Ethereum (ETH/USD): Technical indicators suggest caution. A breakout from the symmetrical triangle pattern in mid-September confirmed weakness, with support levels being repeatedly tested. The 50-day and 100-day moving averages are now sloping downward, reinforcing bearish sentiment.
Candlestick patterns add further complexity to the situation. A series of long red candles, resembling the “three black crows” pattern, confirm ongoing selling pressure. Recent candlesticks near $3,975 reflect hesitation, although long lower shadows suggest attempts at stabilization.
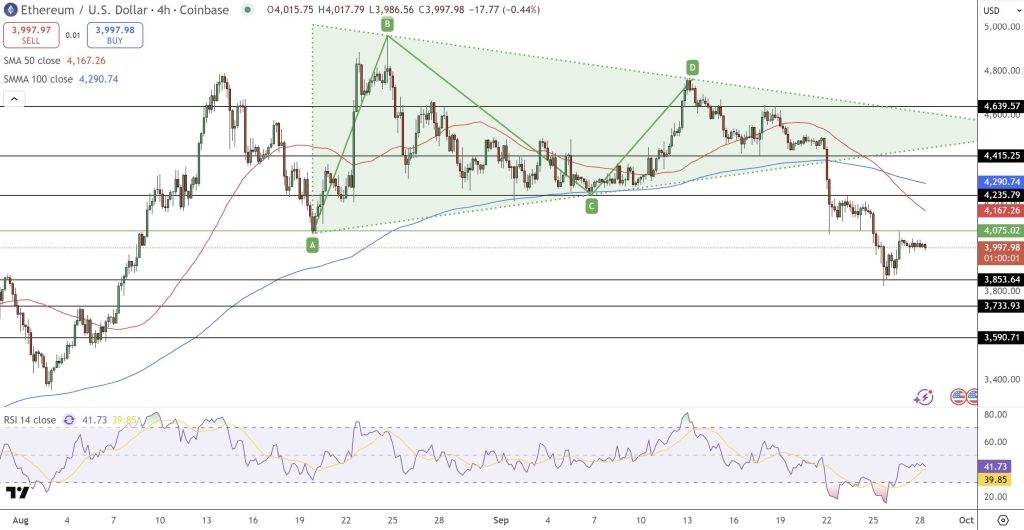
The Relative Strength Index (RSI) has risen from oversold levels to 41, indicating room for a moderate rebound, but no decisive reversal signals have yet appeared.
Key levels that require attention include:
● Resistance levels: $4167 and $4290
● Support levels: $3853, $3733, and $3590
For traders, two scenarios are particularly significant:
Aggressive buyers can enter positions around $3850 to $3900, with the goal of reaching resistance at $4167 and $4290. The stop loss should be set slightly below $3730. A more cautious strategy would be to wait for daily closing prices to confirm a break above $4290 before taking long positions. Conversely, if prices drop below $3850, it could lead to a further decline towards $3590.
Currently, Ethereum is able to hold above $4000 despite being in a period of heavy selling, indicating its resilience. If market sentiment improves and institutional pressure decreases, Ethereum may be able to turn this psychological barrier into the foundation for its next round of gains.