Exchange Ranking
 Top Exchanges
 24h Volume Ranking
 Popularity Ranking
 Exchange BTC Balance
 Proof of Reserves
 Decentralized Exchanges
 Funding Rate
 Funding Heatmap
 Liquidation Data
 Max Pain
 Long/Short Ratio
 Whale L/S Ratio
 Binance/Okex/Huobi L/S
 Bitfinex Margin L/S
 ETF Tracker
 Solana ETF
 XRP ETF
 Hong Kong ETF
 Bitcoin Treasuries
 Crypto Reversal
 Ethereum Reserves
 HyperLiquid Wallet Analysis
 Hyperliquid Whale Watch
 Large Transactions
 On-chain Movement
 Bitcoin ROI
 Stablecoin Market Cap
 Options Analysis
 News
 Articles
 Economic Calendar
 Features
 Wallet
 Contract Calculator


 Security
 Collections
 Watchlist
 Following
 BTC
Can Bitcoin break the opening price in 2026?
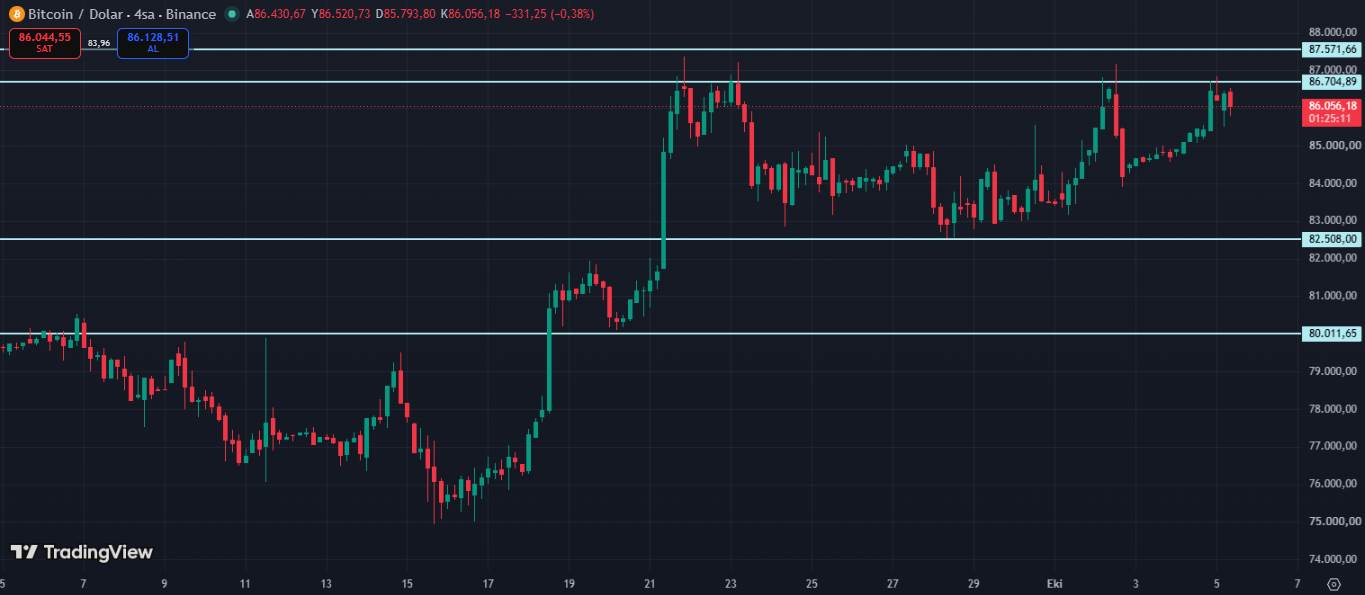
Bitcoin, led by bulls, is undergoing a fierce battle to regain its opening price in 2026. According to Bitstamp, Bitcoin has hit a high weekly closing price of $86,532 since the end of January. Prices hit resistance at $87,000, a clear indication of the market's strong willingness to rise.
Buyers failed to break the annual opening resistance of $87,570 in their fourth attempt since September 21. Short-term charts show that liquidity hunting is still dominating price movements. Trading volume shrank into a narrow range last week as short positions around $85,500 were cleared.
CoinGlass data shows that the order wall around spot prices is thickening. Analyst Rekt Capital pointed out that prices were squeezed between the main support level of $82,500 and the resistance level of $86,700. According to the analyst, holding the $82,500 level could prevent prices from falling back into the $60,000 to $80,000 range. A clear close above $86,700 cleared the path to the $93,700 target.
Is the bond market putting pressure on the cryptocurrency market?
Although the U.S. macro data calendar seems calm this week, the bond market remains the focus of investors 'attention. Last week, U.S. 10-year and 30-year Treasury yields reached 5.34% and 5.69% respectively, the highest levels since 2002. A slight decline after the employment data was released quickly gave way to another rise.
The FOMC minutes released on Wednesday will provide important clues to the Fed's interest rate path. According to the CME FedWatch tool, market expectations for an October rate hike have dropped from 70% to 18%. However, expectations that interest rates will remain high for an extended period of time and the impact of tensions in the Middle East on oil prices continue to put pressure on risky asset and digital asset markets.
Does October historical data support a rising scenario?
Traditionally, October has been one of the periods when bulls are most powerful. CryptoQuant analysts emphasized that Bitcoin has successfully overcome its historical record of weak performance in early October. In the past ten years, the average decline in the first ten days was 0.66%, compared with a 1.4% increase in the same period this year.
Historical data shows that October has historically provided higher returns. For investors managing broad portfolios, past statistics highlight the following opportunities:
- Historical return: Bitcoin ended October with an average gain of 18.7% since 2013.
- Past performance: In the past 13 years, only three October months have recorded negative returns.
- Capital flows: After a successful third quarter, strong seasonal effects pushed up market trading volumes.
By paying close attention to these technologies and macroeconomic developments, you can put your crypto investment strategy on a more solid foundation.
This content absolutely does not constitute investment advice. Markets are highly risky and independent research is crucial before making investment decisions.