Exchange Ranking
 Top Exchanges
 24h Volume Ranking
 Popularity Ranking
 Exchange BTC Balance
 Proof of Reserves
 Decentralized Exchanges
 Funding Rate
 Funding Heatmap
 Liquidation Data
 Max Pain
 Long/Short Ratio
 Whale L/S Ratio
 Binance/Okex/Huobi L/S
 Bitfinex Margin L/S
 ETF Tracker
 Solana ETF
 XRP ETF
 Hong Kong ETF
 Bitcoin Treasuries
 Crypto Reversal
 Ethereum Reserves
 HyperLiquid Wallet Analysis
 Hyperliquid Whale Watch
 Large Transactions
 On-chain Movement
 Bitcoin ROI
 Stablecoin Market Cap
 Options Analysis
 News
 Articles
 Economic Calendar
 Features
 Wallet
 Contract Calculator


 Security
 Collections
 Watchlist
 Following
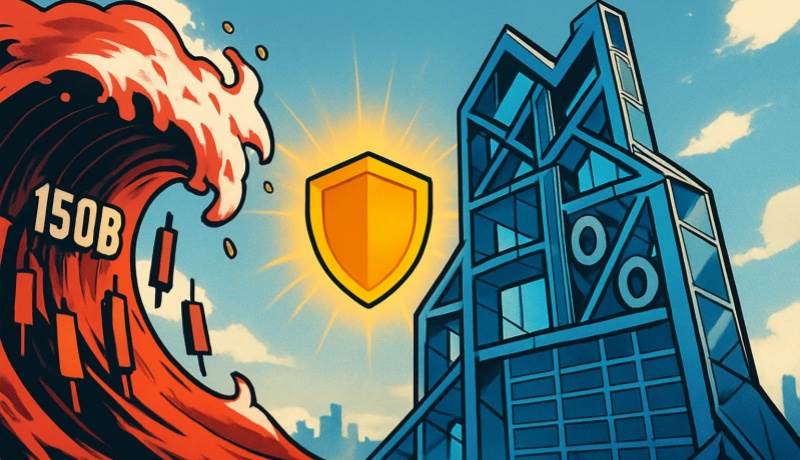
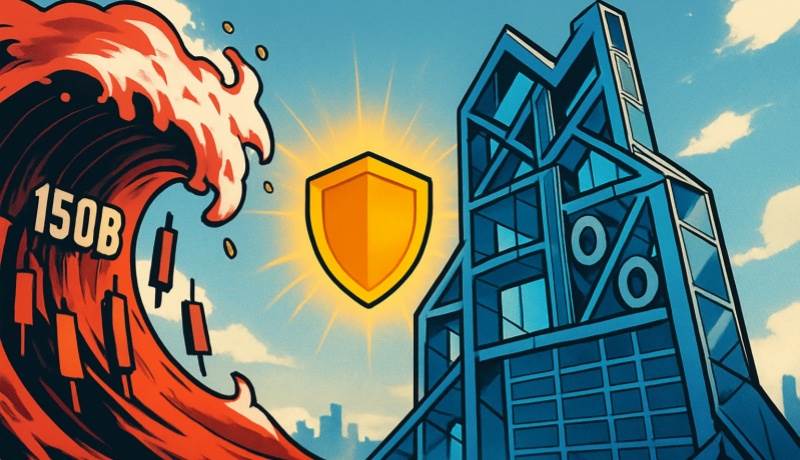
According to CoinGlass data, in 2025, the amount of forced liquidations in the cryptocurrency derivatives market reached $150 billion. This appears to be a year-long crisis, but in reality, it’s a structural phenomenon where derivatives dominate the marginal price markets.
Forced liquidations due to insufficient margin levels are essentially periodic costs imposed on leverage use.
With total derivative transactions reaching $85.7 trillion throughout the year (an average of $264.5 billion per day), liquidations are merely a secondary outcome of the market dynamics, driven by perpetual swaps and basis trading mechanisms.
As derivative trading volume increases, the number of open positions has recovered from the low point of deleveraging during 2022-2023. On October 7th, the nominal value of open Bitcoin positions reached $235.9 billion (during which Bitcoin prices reached $126,000 per unit).
However, record-high open positions, overcrowded long positions, and high leverage levels, combined with Trump’s tariff policies on that day, triggered a global sentiment of risk aversion, leading to a market shift.
Between October 10th and 11th, there were over $19 billion in forced liquidations. Approximately 85%-90% of these liquidations involved long positions. The number of open positions decreased by $70 billion within a few days, and by the end of the year, it dropped to $145.1 billion (still higher than at the beginning of the year).
The core issue behind this volatility lies in the risk amplification mechanism. Regular liquidations rely on insurance funds to absorb losses, while in extreme market conditions, automatic deleveraging mechanisms actually amplify risks.
When liquidity becomes depleted, ADL triggers frequently, forcing reductions in both profit-taking positions and market maker positions. This leads to the failure of market-neutral strategies. The long-tail market is the most affected, with Bitcoin and Ethereum experiencing significant drops of 10%-15%. Most small-cap perpetual contracts also suffer losses of 50%-80%, creating a vicious cycle of “liquidation – price decline – further liquidation”. The concentration of exchanges exacerbates the spread of risks. The top four platforms, such as BN, account for 62% of the world’s derivatives trading volume. During extreme market conditions, simultaneous risk reduction and similar liquidation mechanisms lead to concentrated selling. Additionally, infrastructure such as cross-chain bridges and fiat currency channels are under pressure, causing difficulties in fund flow across exchanges. This renders cross-exchange arbitrage strategies ineffective, further widening price differences. Of course, the annual 150 billion in liquidations isn’t a sign of chaos, but rather a record of how derivatives markets can mitigate risks. As of 2025, no default chain reactions have occurred, but this has exposed the structural limitations of relying on a few exchanges, high leverage, and certain mechanisms. The cost of this is the concentration of losses. In the new year, we need more effective mechanisms and rational trading practices. Otherwise, things will repeat themselves once again.